The thermometer needle and the damage done


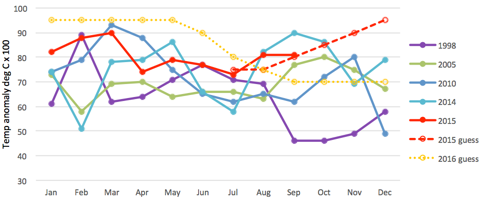
A recent paper published in Nature by Marshall Burke, Solomon M. Hsiang and Edward Miguel Global non-linear effect of temperature on economic production argues that increasing temperatures will cause much greater damage to the world economy than has been previously predicted. Furthermore, these losses will be distributed very unequally, with tropical countries getting hit very hard and some northern countries actually benefitting.

Let me attempt a highly simplified summary to explain what they did. I’m not an economist and their analysis is not straightforward, so beware. If I confuse you, try Dana Nuccitelli’s take or Seth Borenstein’s or Bloomberg’s.

Firstly, Burke et al. looked at factors like labour supply, labour performance and crop yields and how they relate to daily temperature exposure. Generally these show little variation up to temperatures in the high twenties Celsius, at which point they fall off quickly. Secondly, those trends were aggregated to predict the relationship between annual average temperatures and the annual impact on economic output. Thirdly, they looked at annual economic output and average annual temperatures for individual countries for the period 1960-2010. Note that they only compared the economic effects of temperature change on individual countries, they did not correlate one country with another. They were able to see how the observations compared with their predicted aggregate curve.

2015-10-28_11-43-09

From Burke et al. (2015).

This work showed that the GDP of countries with an annual average temperature of 13°C were the least sensitive to temperature changes. Colder countries on the left side of the hump would benefit from an increase in temperature, whereas warmer countries would see their output suffer as temperature increases. Note that the figure does not show that a certain temperature predetermines the level of wealth of a country (China, despite recent rapid growth is poorer than the US and Japan even though average annual temperatures are similar). Rather, it illustrates how susceptible countries are to increases or decreases in productivity relative to their annual average temperature.

There is some evidence that rich countries are slightly less affected by changes in temperature (the curve is a little flatter for them). There are few hot and wealthy countries examined in the study, so any general conclusions about them cannot be certain, but the evidence still points to them being more prone to damage from rising temperature than rich, cooler countries. No matter how rich you are, extra heat hurts the warm lands more than it does the temperate and the cool. You can’t buy your way out of the effects of global warming, except by moving away from the Equator or up into the highlands. Continue reading

Volkswagen Got Caught Cheating Emissions Reporting. Will B.C.?

Originally published at DeSmog Canada on October 7th, 2015.

Volkswagen has admitted to cheating on emissions tests of some of its diesel vehicles. The full story has not yet been made public, but Volkswagen seems not to be an isolated case. There are indications of widespread gaming of emissions testing in the European automobile industry, with regulators and governments turning a blind eye to cheats and being reluctant to introduce testing procedures that would measure actual emissions in real-world conditions.

There are some parallels with the estimation of emissions in the natural gas industry in British Columbia, where officially-sanctioned emissions rates are far lower than in other jurisdictions, compliance inspections are non-existent and methodologies do not include state-of-the art field measurements.

Volkswagen gamed the system

Anyone from North America driving a modern diesel car while on vacation in Europe must have wondered why these economical and high-performance vehicles were not more popular back home. Now we know. Volkswagen introduced a line of diesel vehicles to the U.S. and Canada, but the company only managed to meet nitrogen oxides (NOx) emissions tests by cheating, using so-called defeat devices — software that changed the vehicle’s settings when it sensed that a test was underway. Low NOx emissions are technically feasible, but they entail trade-offs with higher vehicle costs, reduced performance and increased fuel consumption.

As the scandal unfolds, we are starting to learn how Volkswagen — and probably other manufacturers as well — has been gaming vehicle-testing procedures in Europe, not just with NOx emissions, but also with carbon-particle and carbon dioxide emissions. Tests done in unrealistic laboratory-type settings do not reflect real-world performance on the road. Continue reading

The Exxon scandal: an industry insider’s view

I have no additional beans to spill about Exxon’s internal discussions on climate change, so if that is what you were looking for, I offer my apologies and advise you to read no further.

Nor will I spend much time rehashing the recent reports from Inside Climate News, the LA Times, the New York Times or the Guardian that recount what Exxon knew about climate change and what they did to promote doubt and delay climate policy in recent years . What I will offer is my perspective as an ex-oil industry insider on Exxon’s corporate culture and why their downplaying of their own in-house research is perhaps even worse than it appears. I’ll also look at how differently Exxon approached climate change compared to BP and Shell.

I have never worked for Exxon but, in my 30-plus years of oil industry experience, I have had a fair bit of exposure to Exxon’s culture through being involved with project partnerships with them, interactions with Exxon employees at technical conferences, and working with colleagues who had spent their formative years at Exxon. Most of my career was spent working for lesser-known, mid-size companies (Husky Oil, OMV, Encana) rather than the notorious Big Oil Companies. From the perspective of the smaller companies, the giant multinationals are seen as lumbering beasts, slow to act, slow to innovate, secretive and over-confident. Exxon was the biggest of the lumbering beasts, easy to run rings around in mature basins. As an example, consider how the big companies were bystanders and taken by surprise in the North American fracking revolution. Continue reading

2015 and 2016 global temperatures: a “what-if” exercise

It’s hardly news to predict that 2015 is almost certain to break the global surface temperature record.

2015-10-12_12-24-30

The data in this graph are the latest NASA GISS monthly temperature anomalies (1951-1980 baseline), shown in solid lines, while the dashed and dotted lines are from the hitherto little-known future temperature series known as ANDY GUESS, updated in July 2015. I’m not attempting any serious forecasting here, just indulging in a what-if exercise. Note that my starting point in July is a little above the actual GISS value, for that month, this is because NASA subsequently tweaked their data a little. I have just selected a few recent hot years for comparison in this graph.

Basically, I have assumed that the current El Niño will persist until the end of the year, that its effects on global temperatures will lag by six months or so and that this El Niño will run a little hotter than recent ones. I just wanted to see how these guesses would play out for average global temperatures in 2015 and 2016.  The result is shown below.

Continue reading