According to NASA, July 2017 was the warmest July on record, just slightly higher than July 2016. The global average anomaly was 0.83° C.
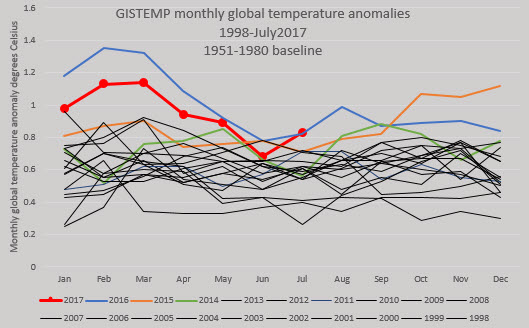


According to NASA, July 2017 was the warmest July on record, just slightly higher than July 2016. The global average anomaly was 0.83° C.
")
I update the GISTEMP records every month, but I missed writing up April’s monthly summary. Real-world events have set my priorities elsewhere and this May 2017 write-up is a couple of weeks overdue. Monthly updates are probably overkill anyway, especially when there are no dramatic changes taking place.
Here is how May’s monthly global average looked relative to all months since January 1998.
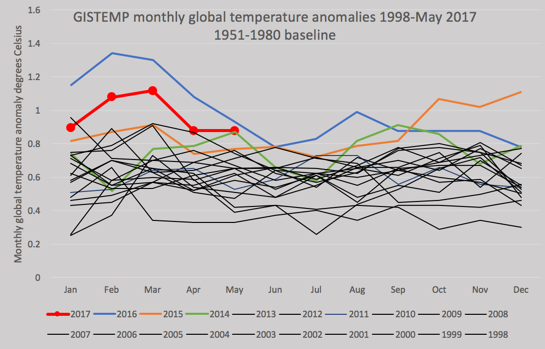
May 2017 was the second-warmest May anomaly ever and was in the top 16 22 or so of all months ever recorded. Continue reading

This is a quick update to my temperature graphs based on the latest NASA GISTEMP numbers. First, the monthly anomalies.


I used to do regular monthly global surface temperature updates earlier this year, but I stopped a few months ago. I was getting bored with writing them and I noticed that readers weren’t reading them either. Also, Tamino and Sou do an excellent and timely job on this and I can add little to their commentary or figures.
Nevertheless, I do update my graphs regularly for myself and I thought I would do one last post to wrap up the year, even if all of the data are not yet in.

Climate scientists are certain that human-caused emissions have increased carbon dioxide in the atmosphere by 44 per cent since the Industrial Revolution. Very few of them dispute that this has already caused average global temperatures to rise roughly 1 degree. Accompanying the warming is disruption to weather patterns, rising sea levels and increased ocean acidity. There is no doubt that further emissions will only make matters worse, possibly much worse. In a nutshell, that is the settled science on human-caused climate change.
What scientists cannot yet pin down is exactly how much warming we will get in the future. They do not know with precision how much a given quantity of emissions will lead to increased concentrations of greenhouse gases in the atmosphere. For climate impact it is the concentrations that matter, not the emissions. Up until now, 29 per cent of human emissions of carbon dioxide has been taken up by the oceans, 28 per cent has been absorbed by plant growth on land, and the remaining 43 per cent has accumulated in the atmosphere. Humans have increased carbon dioxide concentrations in the atmosphere from a pre-industrial level of 280 parts per million to over 400 today, a level not seen for millions of years. Continue reading

The huge El Niño of 2015-2016 has now ended and global surface temperatures are now declining very quickly. In fact, the global temperature anomaly fall from February-May 2016 was 0.40°C; the biggest three-month decline since November 1928-February 1929 (0.48°C). Even the times of big volcanoes like Pinatubo did not see such rapid declines over any three-month period. This is surely a result of the extraordinary intensity of the now-departed El Niño.

Despite the rapid decline, May 2016 was the warmest May in the temperature record and had the highest temperature anomaly for any month in the record prior to October 2015. [Edit, this is not right, actually it was the second highest; January 2007 recorded an anomaly of 0.96 degrees, h/t Sou.] Nevertheless, the period of extraordinary record-breaking monthly records could well be over soon. All of the temperatures shown in this post are NASA’s GISTEMP data. Continue reading

Forgive the facetious, click-bait headline.
The NASA GISTEMP global temperature anomalies for March are now available. March 2016 had by far the largest temperature anomaly (1.28°C) for any March on record and the second highest anomaly for any month ever, beaten only by February 2016 (1.34°C), hence the snarky headline.
Here is the plot of month-by-month anomalies for recent warm years.
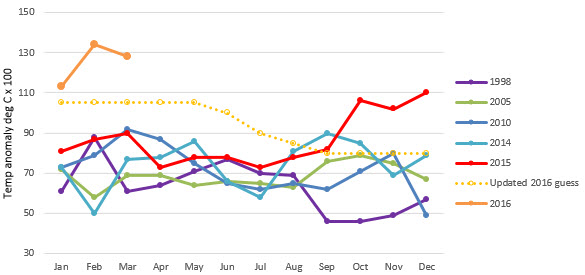
Clearly, my guesswork, what-if, forecast for the year is still running one-tenth of a degree cool. The NOAA forecast is for the El Niño to end in the next few months, with a rising probability of a La Niña forming in the latter half of the year. Continue reading

Originally published at Corporate Knights on March 17, 2016.
Sorry Ted Cruz. There’s no conspiracy among scientists to exaggerate global warming by fudging the numbers.
Last year was the warmest year recorded since the measurement of global surface temperatures began in the nineteenth century. The second-warmest year ever was 2014. Moreover, because of the persisting effects of the equatorial Pacific Ocean phenomenon known as El Niño, many experts are predicting that 2016 could set a new annual record. January and February have already set new monthly records, with February half a degree Celsius warmer than any February in history.
This news is deeply unsettling for those who care about the future of the planet. But it is even more upsetting for people opposed to climate mitigation, since it refutes their favourite talking point – that global warming has stalled in recent years.
U.S. Congressman Lamar Smith claims there has been a conspiracy among scientists to fudge the surface temperature records upwards and has demanded, by subpoena, to have scientists’ emails released.
Senator and presidential candidate Ted Cruz recently organized a Senate hearing on the temperature record in which he called upon carefully selected witnesses to testify that calculations of temperature made by satellite observations of the upper atmosphere are superior to measurements made by thermometers at the Earth’s surface.
It’s easy to cherry-pick data in order to bamboozle people. The process of making consistent temperature records from surface measurements and satellite observations is complicated and is easy to misrepresent.
But the fact remains that there are no conspiracies afoot. Here’s why. Continue reading
The Denial 101x MOOC (Massive Open Online Course) was a great success, with thousands of participants and many satisfied students. I admit that I was quite touched by the mostly positive student reactions and I am thankful to John Cook for inviting me to contribute to this course in a small way. This video compilation of students’ feedback shows how people from diverse backgrounds all got something from the course.
From July 1, 2015 onwards, the course is available for anyone to follow at their own pace. It’s completely free of charge, naturally!
One of my pastimes is downloading data and playing around with it on Excel. I’m not kidding myself that doing this means anything in terms of original research, but I do find that I learn quite a lot about the particularities of the data and about the science in general by doing some simple calculations and graphing the numbers. There’s even occasionally a small feeling of discovery, a bit like the kind that you experience when you follow a well-trodden path in the mountains for the first time:
We were not pioneers ourselves, but we journeyed over old trails that were new to us, and with hearts open. Who shall distinguish? J. Monroe Thorington
Anyway, I downloaded some historical emissions data from the CDIAC site and played around with it. To repeat, there’s nothing new to science here, but there were a few things that I found that were new to me. First, let’s look at historical emissions of CO2 from man-made sources from 1850 to 2010. Note that for all of these graphs there are no data shown for 2011-2015.

What immediately struck me—something I hadn’t fully appreciated before—was how small oil consumption was before 1950. Both world wars were carried out without huge increases in oil use, despite the massive mobilizations of armies, navies and air forces. You can make out some downward blips in coal consumption for the Great Depression (~1930) and around the end of WW2 (~1945).
It wasn’t until after 1950 that fossil-fuel consumption went nuts. Some people have taken to calling this inflection point The Great Acceleration, there’s more on this later. Continue reading
the contemporary archaeology of prehistory
A grumpy view of earth science and the world
Funnies, rants, and quite a lot of gin
Essays, musings & missives - concerning science, art & society
Culture & Natural Heritage
Discovering Global Environmental Interconnections
Just 50 years ago, no one knew why the Earth has mountains. Now we do. This is the story of how we figured it out - and how we keep learning.
Science, policy and decision-making
A BLOG BY G.P. WAYNE
Thoughts on climate policy in Canada and around the world
Environmental science of climate, carbon, and energy
The World of Guy Dauncey
film reviews and related ramblings
Once you have finished counting diatoms, the real fun begins
Writer / Videographer
Reflections on the refractory problems of climate and energy
Ventures into skepticism
Climate science from the inside
likhipa inhlanzi emanzini
