
Forgive the facetious, click-bait headline.
The NASA GISTEMP global temperature anomalies for March are now available. March 2016 had by far the largest temperature anomaly (1.28°C) for any March on record and the second highest anomaly for any month ever, beaten only by February 2016 (1.34°C), hence the snarky headline.
Here is the plot of month-by-month anomalies for recent warm years.
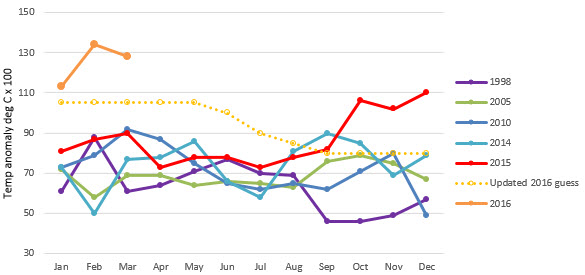
Clearly, my guesswork, what-if, forecast for the year is still running one-tenth of a degree cool. The NOAA forecast is for the El Niño to end in the next few months, with a rising probability of a La Niña forming in the latter half of the year.
Here is a plot of annual temperatures, with the X showing the year-to-date anomaly and the orange dot the end 2016 average temperature following my guesswork.

For 2016 to not set a new annual record will involve average temperature anomaly for the last nine months to be less than 0.73°C. This looks unlikely based on the top graph, but every year before 2014 had an average temperature anomaly for the last nine months lower than that.
Let’s look at how full-year average temperature anomalies cross-plot with the average for the first few months since 1880.

In general, the first three months run warmer than the average for the whole year. They fit fairly well around a linear regression line shown in blue. I added a couple of parallel lines to encompass all of the historical variations. 2016 is shown as the red dot way over on the top right-hand side. Using the regression line would imply that the 2016 annual temperature will smash all previous records, but this is unlikely since the trend for the rest of the year is almost certainly down compared to the extraordinarily warm start.
Most likely, the actual annual temperature anomaly will end up being somewhere along the line shown by the green arrow. It is possible that 2016 will not be a record year, but only just if this analysis applies.
Here’s the global map from NASA
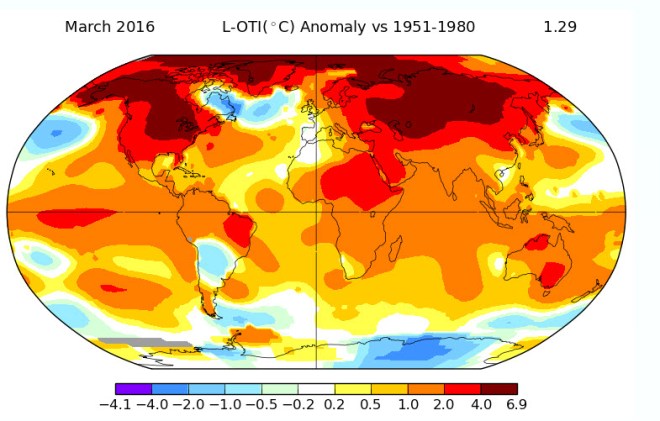
The global temperature anomalies are distributed pretty much as they were last month, with a lot of anomalous heat in the Arctic and the continental interiors of North America and Asia. The melt season in Greenland seems to have started two months early this year. Interesting times.
I’ll add graphs from other blogs as they become available.
Here is a plot from Gavin Schmidt, via Twitter

That’s similar to the plot I made above (I got the idea to do a plot like this from one Schmidt made in November 2015). He is more confident than me in his predictions:

Here are two from Sou

Sou cautions that the next graph is a bit premature

And two from Tamino at Open Mind

At least one month of 2016 will likely be cooler than one month of 2015, maybe even two or three. And that will be the extent of the “pause” for 2016…
Yes, we could easily see twelve consecutive monthly records, as well as three consecutive annual records by the end of 2016.
It will be very interesting to see at what temperature ENSO neutral years and La Nina come in at.
CO2 emissions continue to go up, yet temperatures are headed *down* – let me guess, you refuse to use real science and accept that your catastrophic global warming *theory* is obviously falsified? (Forgive the riffing on the facetious, click-bait headline….)
It’s a fair cop. 😉
Back to the drawing board with all that climate forcing stuff…