According to NASA, July 2017 was the warmest July on record, just slightly higher than July 2016. The global average anomaly was 0.83° C.
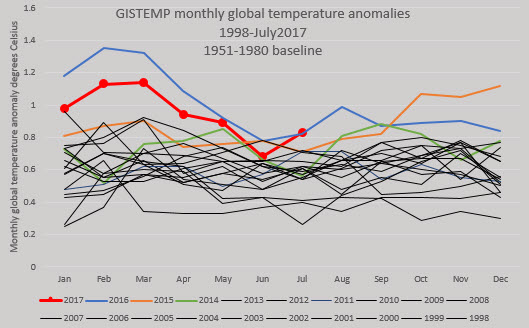


According to NASA, July 2017 was the warmest July on record, just slightly higher than July 2016. The global average anomaly was 0.83° C.
")
I update the GISTEMP records every month, but I missed writing up April’s monthly summary. Real-world events have set my priorities elsewhere and this May 2017 write-up is a couple of weeks overdue. Monthly updates are probably overkill anyway, especially when there are no dramatic changes taking place.
Here is how May’s monthly global average looked relative to all months since January 1998.
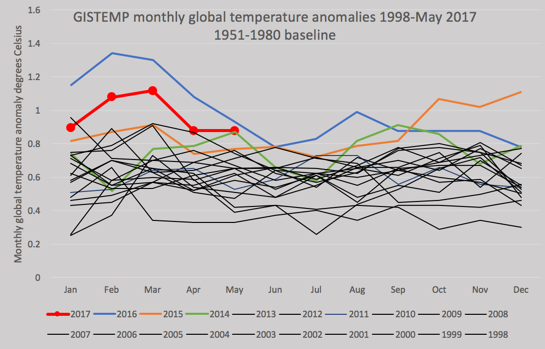
May 2017 was the second-warmest May anomaly ever and was in the top 16 22 or so of all months ever recorded. Continue reading

This is a quick update to my temperature graphs based on the latest NASA GISTEMP numbers. First, the monthly anomalies.


A graph that I included in my last monthly surface temperature blog post attracted a lot of attention thanks to a Tweet by Eric Holthaus.
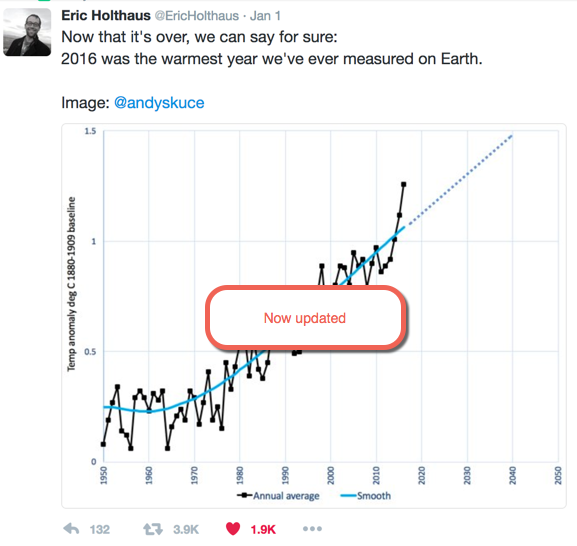

I used to do regular monthly global surface temperature updates earlier this year, but I stopped a few months ago. I was getting bored with writing them and I noticed that readers weren’t reading them either. Also, Tamino and Sou do an excellent and timely job on this and I can add little to their commentary or figures.
Nevertheless, I do update my graphs regularly for myself and I thought I would do one last post to wrap up the year, even if all of the data are not yet in.

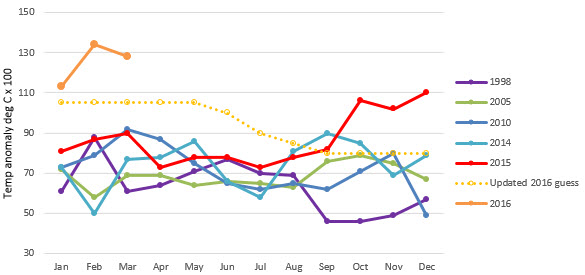
The GISTEMP (NASA) data for July 2016 came out a few days ago and the records keep falling. July 2016 was warmer than any July on record by more than one-tenth of a degree..

That makes 10 months in a row of all-time monthly records, although June 2016 has now been revised down by one-hundredth of a degree to give a tie with June 2015. July anomalies are now close to my guesswork from the start of the year. I underestimated the January-March El Niño warmth and did not expect the rapid decline from March to June. My updated guess for the 2016 annual anomaly is now 0.96°C, a big jump from 2015’s 0.87°C. For 2016 not to be a record, temperature anomalies for the rest of the year would have to average below 0.61°C, something that hasn’t happened since 2008. Year-to-date average anomalies are 1.06°C. Continue reading

NASA has released its global surface temperature anomaly calculation for June 2016 and it sets a new record for June. June 2016 had an anomaly of 0.79°C, edging out the previous record from June 2015 (0.78°C) and the previous record from June 1998( 0.77°C). As the mighty El Niño of 2015/2016 has ended, no longer are monthly temperature anomalies setting blockbuster records, mere records are all we are left with. The string of monthly records now extends to nine and may continue for a few more.

The four-month decline from February to June was 0.54°C, the largest four-month decline on record. (The second-largest decline, since you ask, was 0.52°C from August to December 1916.)

The huge El Niño of 2015-2016 has now ended and global surface temperatures are now declining very quickly. In fact, the global temperature anomaly fall from February-May 2016 was 0.40°C; the biggest three-month decline since November 1928-February 1929 (0.48°C). Even the times of big volcanoes like Pinatubo did not see such rapid declines over any three-month period. This is surely a result of the extraordinary intensity of the now-departed El Niño.

Despite the rapid decline, May 2016 was the warmest May in the temperature record and had the highest temperature anomaly for any month in the record prior to October 2015. [Edit, this is not right, actually it was the second highest; January 2007 recorded an anomaly of 0.96 degrees, h/t Sou.] Nevertheless, the period of extraordinary record-breaking monthly records could well be over soon. All of the temperatures shown in this post are NASA’s GISTEMP data. Continue reading

UPDATE: A respected blogger contacted me privately and told me that some of the figures I posted here originally were misleading and hard to understand. I agree, so I have redone this post a little with the aim of improving clarity.
The GISTEMP global temperature anomalies are now out for April 2016.


Forgive the facetious, click-bait headline.
The NASA GISTEMP global temperature anomalies for March are now available. March 2016 had by far the largest temperature anomaly (1.28°C) for any March on record and the second highest anomaly for any month ever, beaten only by February 2016 (1.34°C), hence the snarky headline.
Here is the plot of month-by-month anomalies for recent warm years.
Clearly, my guesswork, what-if, forecast for the year is still running one-tenth of a degree cool. The NOAA forecast is for the El Niño to end in the next few months, with a rising probability of a La Niña forming in the latter half of the year. Continue reading
the contemporary archaeology of prehistory
A grumpy view of earth science and the world
Funnies, rants, and quite a lot of gin
Essays, musings & missives - concerning science, art & society
Culture & Natural Heritage
Discovering Global Environmental Interconnections
Just 50 years ago, no one knew why the Earth has mountains. Now we do. This is the story of how we figured it out - and how we keep learning.
Science, policy and decision-making
A BLOG BY G.P. WAYNE
Thoughts on climate policy in Canada and around the world
Environmental science of climate, carbon, and energy
The World of Guy Dauncey
film reviews and related ramblings
Once you have finished counting diatoms, the real fun begins
Writer / Videographer
Reflections on the refractory problems of climate and energy
Ventures into skepticism
Climate science from the inside
likhipa inhlanzi emanzini
