
NASA has released its global surface temperature anomaly calculation for June 2016 and it sets a new record for June. June 2016 had an anomaly of 0.79°C, edging out the previous record from June 2015 (0.78°C) and the previous record from June 1998( 0.77°C). As the mighty El Niño of 2015/2016 has ended, no longer are monthly temperature anomalies setting blockbuster records, mere records are all we are left with. The string of monthly records now extends to nine and may continue for a few more.

The four-month decline from February to June was 0.54°C, the largest four-month decline on record. (The second-largest decline, since you ask, was 0.52°C from August to December 1916.)
The first six months of 2016 produced an anomaly of 1.09°C, by far the warmest six-month period on record. To break the annual record of 0.86°C set in 2015 will require the rest of 2016 to average 0.63°C. The last time the July-December average fell below this level was in 2008, but it also occurred in 2007 and 2004 and every year prior to 2003. Looked at from this point of view, not setting a record high for 2016 does not look completely implausible.
My guesswork forecast from January 2016, shown by the dotted orange line above, is now running warm by one tenth of a degree. Using actual temperatures for January to June and my guesswork from July to December would yield an average annual anomaly of 0.96°C for 2016, shown by the orange dot in the figure below.
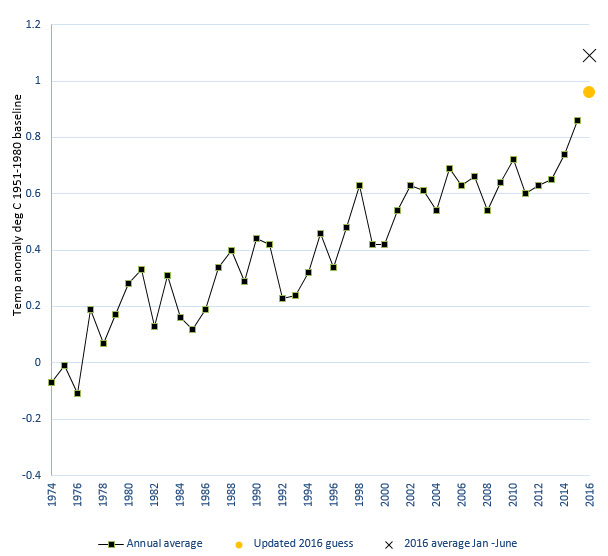
For 2016 to exceed an average anomaly of 1.0°C would require temperatures for the latter half of the year to exceed 0.91°C, a value that has only been achieved once before, in July-December 2015, as the big El Niño set in. It is unlikely that we will see a 1.0°C record set this year.
Remember, of course, that the NASA anomalies are measured according to a 1951-1980 baseline. If we instead use a “pre-industrial” baseline used for policy discussions we would increase the anomaly by about 0.26°C. It will take a Pinatubo-sized volcano to see temperature anomalies drop below 1.0°C from pre-industrial baseline and the relief will be temporary. We’re halfway to 2°C and still emitting like there’s no tomorrow.
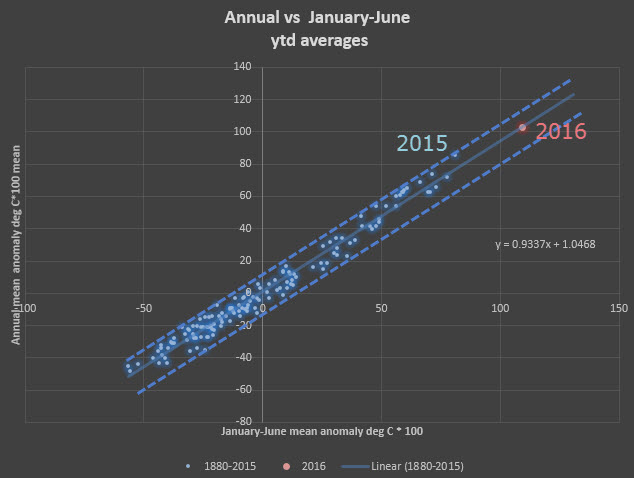
Above is my graph showing a cross-plot between January-June average tempertaures and annual temperatures. Using the linear regression equation to estimate 2016 year-end temperatures yields an estimate of 1.03°C. (Doing this for post-1950 anomalies only yields 1.06°C.) As the months roll by, the slope of the curve naturally approaches 1 and the parallel uncertainty bands shown by the dashed lines shrink closer to the regression line (here’s the March version of this graph for comparison).
For there not to be a record in 2016, the mid-year to year-end average would have to drop by 0.17°C. The largest recorded drop over the history of the GISTEMP data was 0.13°C in 1992, in the year following the Mount Pinatubo eruption.The largest drops since then were around 0.07°C in 1993, 1998, 2002 and 2007. It seems highly probable, then, that even with a big volcanic eruption or a strong La Niña we will see a global temperature record broken for a third year in a row in 2016.
Here is the global map for June 2016 alongside May, for comparison.

Note the scale change for the extremes in the scale bars.
For most of the planet, the changes are not very obvious, with the warm and cool blobs moving around a bit in northern latitudes. Although the Antarctic Peninsula is still very warm, the anomalies in the rest of Antarctica shifted from relatively warm in May to very cool in June. To illustrate this further, I downloaded GISTEMP zonal data for May and June and plotted them.

Plainly, the change in global temperature anomalies between May and June happened mostly south of 60°S, despite the continued relative warmth on the Antarctic Peninsula. I do not know why this should be so, nor do I know how reliable these particular data are. I would welcome commentary from readers who may have a clue.
