
The GISTEMP (NASA) data for July 2016 came out a few days ago and the records keep falling. July 2016 was warmer than any July on record by more than one-tenth of a degree..

That makes 10 months in a row of all-time monthly records, although June 2016 has now been revised down by one-hundredth of a degree to give a tie with June 2015. July anomalies are now close to my guesswork from the start of the year. I underestimated the January-March El Niño warmth and did not expect the rapid decline from March to June. My updated guess for the 2016 annual anomaly is now 0.96°C, a big jump from 2015’s 0.87°C. For 2016 not to be a record, temperature anomalies for the rest of the year would have to average below 0.61°C, something that hasn’t happened since 2008. Year-to-date average anomalies are 1.06°C.

Because the land in the world is mostly in the northern hemisphere, because land warms more than ocean in summer and because it is summer in the north, the July monthly record is also the single warmest month ever in absolute temperatures.

Here is my cross-plot of annual averages versus January to July averages for the entire GISTEMP record. The slope of the regression is naturally line is homing in on 1.0 as the end of the year draws closer.
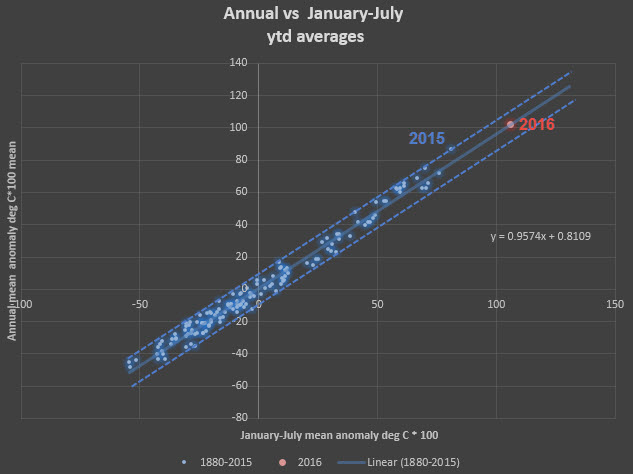
The dashed lines are drawn to encompass all past variation. Because of the exceptionally warm start to the year it is unlikely that the average-to-date anomalies will rise above the 1.02°C value predicted for 2016 (there’s no El Niño in prospect). The lower bound is around 0.90°C. So, my guesswork value of 0.96°C, mentioned above, would fortuitously fall slap in the middle.
It looks to be very likely indeed that the annual anomalies for 2016 will set a new record, for an unprecedented third year in a row.
Here’s the graph for 1950-2015. This is arguably a more representative sample of Anthropocene temperature anomalies.
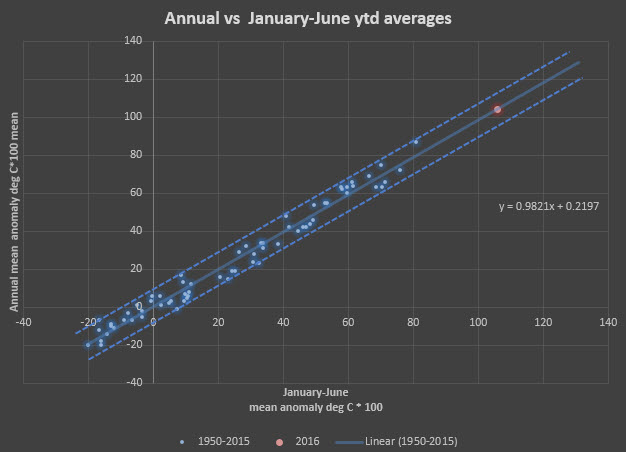
This predicts a slightly higher 2016 annual average of 1.04°C, compared to the post-1880 graph.
As always, Sou at HotWhopper has some excellent graphs, buy I’ll just steal her signature progressive year to date graph. 2016 is turning out to be the Usain Bolt year, starting to fade from previous records, but still way ahead of the pack.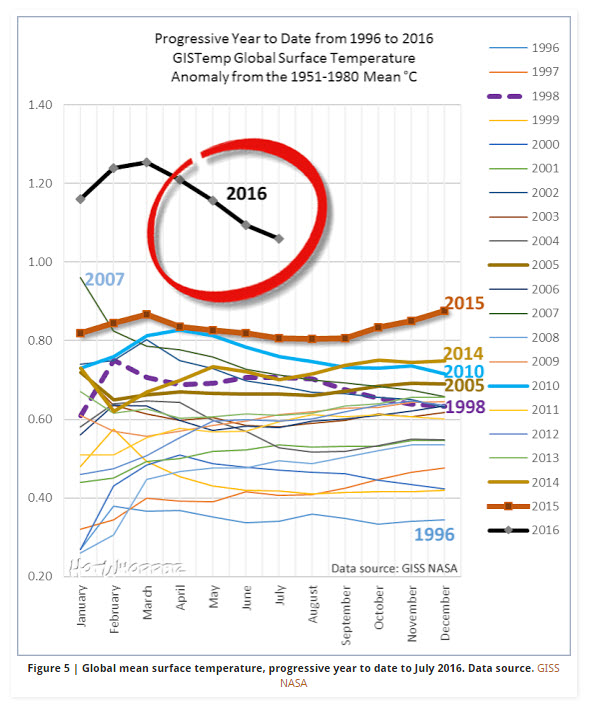
That’s all for now.

Pingback: Global temperatures anomalies July 2016: still warmer than than ever – Enjeux énergies et environnement