
According to NASA, July 2017 was the warmest July on record, just slightly higher than July 2016. The global average anomaly was 0.83° C.
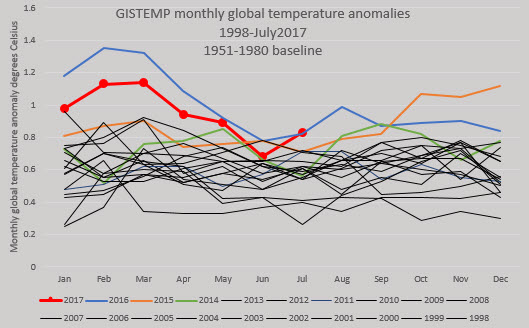
The year-to-date average anomaly is 0.94° C.
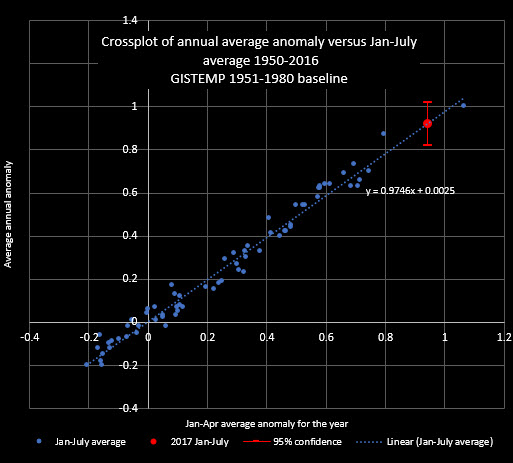
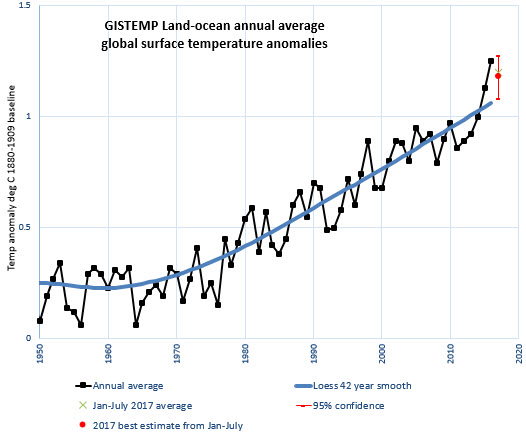
(Oops, the x-axis label is wrong. It should read “Jan-July average anomaly for the year” I’ll fix the graph later.)
Using a simple regression on past year-to-date averages versus full annual averages produces a predicted year-end anomaly of 0.92° C, plus or minus 0.1° C.
Here is what this prediction looks like in the context of anomalies since 1950.
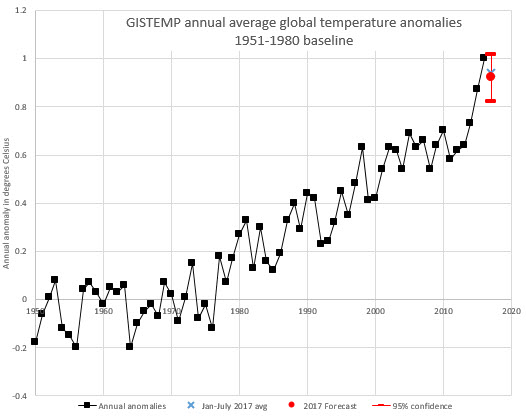
There is a strong likelihood (80%) that 2017 will be the second warmest year on record. There’s still a 5% possibility that this year will set a new record and a 15% chance that 2017 will place third. These predictions are all based on simple statistics and involve no actual meteorological input. So, caveat lector!
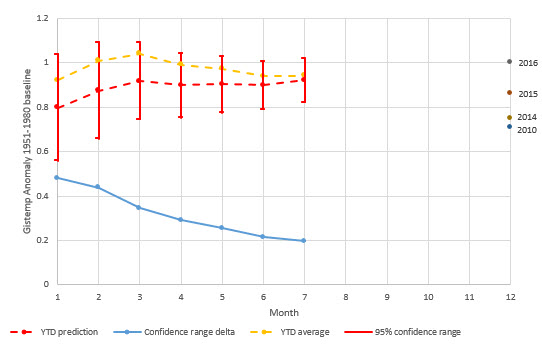
As the months pass the uncertainty of the year-end prediction naturally shrinks.
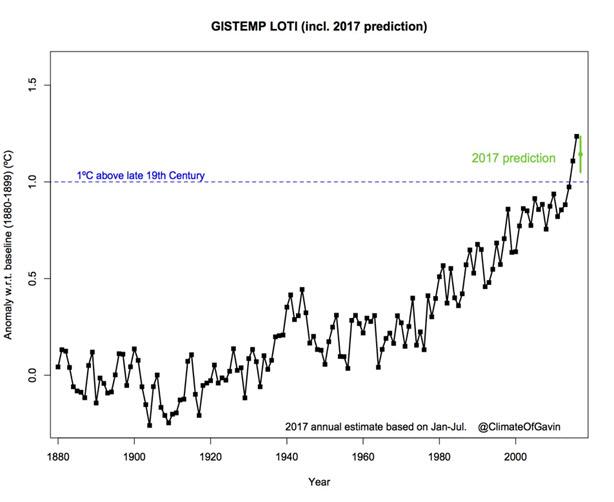
Here is the prediction in the context of long-term warming trends in relation to a rough pre-industrial baseline.
It’s almost certain that 2017 will be well above the long-term trend. This is despite negligible El Niño influence this year.
Here is Gavin Schmidt’s prediction, for comparison. It’s along the same lines, but with slightly different values and uncertainties. He foresees a 77% chance of a 2017 second place.

Pingback: July 2017 global temperature anomaly update – Enjeux énergies et environnement