June 2016 surface temperatures break monthly record, but not by much

June 2016 surface temperatures break monthly record, but not by much

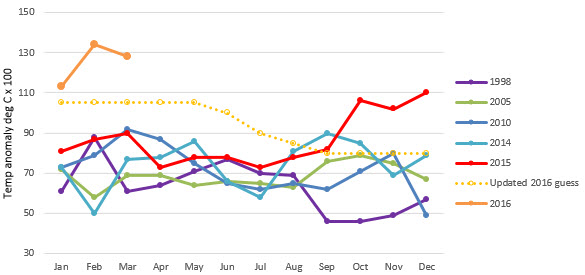
NASA has released its global surface temperature anomaly calculation for June 2016 and it sets a new record for June. June 2016 had an anomaly of 0.79°C, edging out the previous record from June 2015 (0.78°C) and the previous record from June 1998( 0.77°C). As the mighty El Niño of 2015/2016 has ended, no longer are monthly temperature anomalies setting blockbuster records, mere records are all we are left with. The string of monthly records now extends to nine and may continue for a few more.

2016-07-19_17-08-20

The four-month decline from February to June was 0.54°C, the largest four-month decline on record. (The second-largest decline, since you ask, was 0.52°C from August to December 1916.)

Continue reading

No global warming since February 2016

No global warming since February 2016

Forgive the facetious, click-bait headline.

The NASA GISTEMP global temperature anomalies for March are now available. March 2016 had by far the largest temperature anomaly (1.28°C) for any March on record and the second highest anomaly for any month ever, beaten only by February 2016 (1.34°C), hence the snarky headline.

Here is the plot of month-by-month anomalies for recent warm years.

2016-04-15_10-14-37

Clearly, my guesswork, what-if, forecast for the year is still running one-tenth of a degree cool. The NOAA forecast is for the El Niño to end in the next few months, with a rising probability of a La Niña forming in the latter half of the year. Continue reading

NASA January 2016 temperature update

The NASA GISTEMP global average surface temperature data have been updated to include January 2016, which had the largest monthly temperature anomaly ever recorded: 1.13°Celsius above the 1951-1980 baseline. This is slightly above the  December 2015 anomaly of 1.11°C.

2016-02-16_16-06-22

The graph shows month-by-month anomalies for selected warm years. In addition, I have added my guess for how monthly temperatures might trend over the year. This is not an expert forecast and I have done it just to calculate what the annual surface temperature for 2016 would be if that trajectory were followed. Basically, I have assumed that the elevated temperature attributable to the big El Niño will persist until May and will drop off until September. My guess is that the annual anomaly for 2016 will be 0.93°C, 0.07°C higher than 2015. This is shown by the orange dot in the graph below. Continue reading

NASA October temperature update: a new monthly record

Wow. Just in time for Paris.

My guesswork now looks a little lame as the Nasa October land-ocean temperature anomaly shoots upwards to a new record of 1.04 degrees Celsius.

2015-11-16_16-56-06

Monthly anomalies for selected hot years since 1998. My guesswork forecasts are shown in dashed and dotted lines. Data from NASA.

A clear all-time temperature record for 2015 is now assured, because November and December anomalies would now have to be less than 0.34 degrees, a level not seen for those months since 2000, for 2014 to retain the warmest year record.

My original anomaly forecast for the year was 0.82 degrees C , which is unchanged below, but is clearly now conservative and is shown  by the red square. The red cross (0.86 degrees C) is a projection based on November and December averaging the same anomaly as October.2015-11-16_17-41-51

As Michael Caine put it: Continue reading

2015 and 2016 global temperatures: a “what-if” exercise

It’s hardly news to predict that 2015 is almost certain to break the global surface temperature record.

2015-10-12_12-24-30

The data in this graph are the latest NASA GISS monthly temperature anomalies (1951-1980 baseline), shown in solid lines, while the dashed and dotted lines are from the hitherto little-known future temperature series known as ANDY GUESS, updated in July 2015. I’m not attempting any serious forecasting here, just indulging in a what-if exercise. Note that my starting point in July is a little above the actual GISS value, for that month, this is because NASA subsequently tweaked their data a little. I have just selected a few recent hot years for comparison in this graph.

Basically, I have assumed that the current El Niño will persist until the end of the year, that its effects on global temperatures will lag by six months or so and that this El Niño will run a little hotter than recent ones. I just wanted to see how these guesses would play out for average global temperatures in 2015 and 2016.  The result is shown below.

Continue reading