
The NASA GISTEMP global average surface temperature data have been updated to include January 2016, which had the largest monthly temperature anomaly ever recorded: 1.13°Celsius above the 1951-1980 baseline. This is slightly above the December 2015 anomaly of 1.11°C.

The graph shows month-by-month anomalies for selected warm years. In addition, I have added my guess for how monthly temperatures might trend over the year. This is not an expert forecast and I have done it just to calculate what the annual surface temperature for 2016 would be if that trajectory were followed. Basically, I have assumed that the elevated temperature attributable to the big El Niño will persist until May and will drop off until September. My guess is that the annual anomaly for 2016 will be 0.93°C, 0.07°C higher than 2015. This is shown by the orange dot in the graph below.

The X shows the average for the year so far, not terribly meaningful at this point because it includes just one month. Before I saw the January numbers, I had revised the guess I made in mid-2015 (even though I said I wouldn’t), upping it by 0.1°C. Clearly, I had been underestimating the effect of the El Niño and perhaps still am.
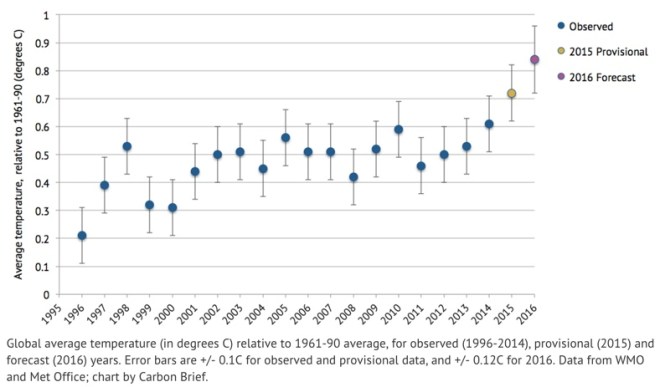
As I mentioned in a previous post, Britain’s Met Office, predicts a jump in global average surface temperatures of about 0.12°C (±0.12°C) from 2015 to 2016. Applying a similar increase to the GISS data would see a 2016 average anomaly of 0.98°C, with an uncertainty range of 0.86-1.10°C.
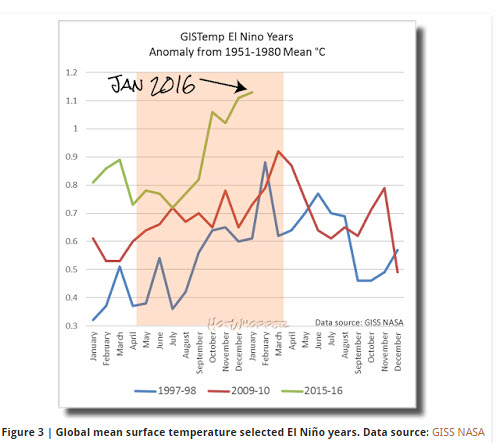
Another record year looks likely for 2016, but if a La Niña develops earlier than expected it could be close. Via Sou’s Hot Whopper blog, here is how previous El Niño years have unfolded compared to this one:
The warmth is not equally distributed across the planet. Here is NASA’s global map.

The highest anomalies are mostly in the high northern latitudes.

The average anomaly above the Arctic Circle is 4°C, with anomalies averaging around 7°C near the North Pole. It will be interesting to see how this warmth expresses itself as the Arctic sea-ice melt season begins in a few week’s time. As of February 3rd, the sea-ice extent is at its lowest ever recorded for that date.


thanks for the update Andy. (Idly curious, did you model your forecast after any particular El Nino strength/prior example?)
Thanks. It’s not really a forecast but a rough what-if exercise for illustrative purposes. My original intent was to provoke better from others who know more than me. All I have done is to continue present high temperatures for a few more months and then to have them decline by 0.25 degrees over a few following months. It’s approximately consistent with the “Figure 3” that I copied from Sou’s blog, which shows the El Niños from 2010 and 1998.
The Met Office forecast is clearly a proper science-based forecast, but they don’t (as far as I know) provide a month-to-month forecast, just an annual average for 2016.