Corrections, misties and anomalies

Corrections, misties and anomalies

Apologies to all who came here earlier. I mistakenly published this yesterday before it was finished.

I don’t read denialist blogs very often. Life is too short. And there are more interesting scientific and policy problems to grapple with than trying to figure out where some guy on Watt’s Up With That, with no background in climate science, gets his facts and reasoning all wrong.

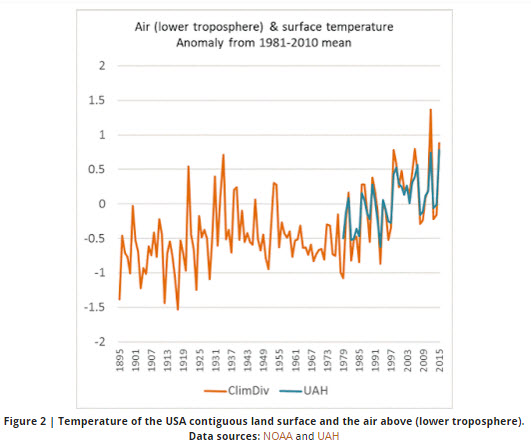
Luckily, dipping into Sou’s excellent blog, Hot Whopper, saves me a lot of time and keeps me up to date on all the craziness. A recent article of Sou’s: Desperate Deniers Part 2: David Middleton fakes satellite data “Just for grins” does an excellent job of debunking a WUWT post by David Middleton (archived here). Sou mainly focuses on a graph that Middleton drew comparing contiguous US land surface temperatures with global lower troposphere temperatures. Fish in a barrel.

Sou does show that NOAA’s corrected annual land surface temperature anomalies for the CONUS actually compare quite nicely with the lower troposphere data above the same region as prepared by the University of Alabama Huntsville. Thus:

2016-01-23_17-27-37

What caught my eye about David Middleton’s post was this: Continue reading

A global temperature record for 2015

A global temperature record for 2015

The 2015 data are now in for Nasa’s GISTEMP surface temperature record. (News release, slides, data.) As expected, 2015 is the warmest year in the series. By far. The two warmest years in recorded global history were 2014 and 2015. Fifteen of the sixteen warmest years on record have occurred since 2001. December 2015 was the warmest month ever recorded.

2016-01-20_9-00-32

The smooth lines are 42-point and 12-point Loess filter calculations. I defy anyone to identify the much-ballyhooed “pause”.

According to Britain’s Met Office, 2016 is likely to be warmer still. The increase from 2015 t0 2016 is likely to be as big as the jump from 2014 to 2015.

2016-01-05_18-23-14
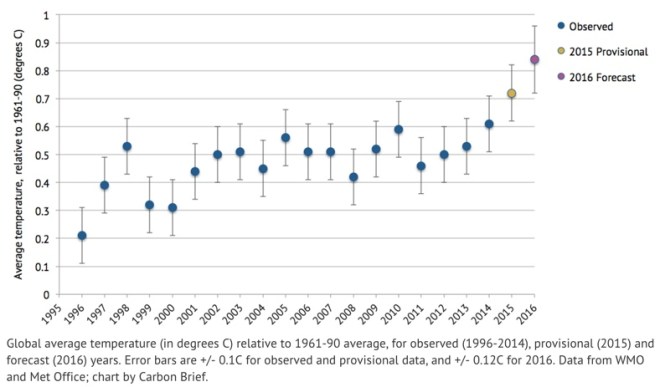
If this happens, it will be the first time ever in the history of global surface thermometer records that there were three years of consecutive new records. Even if 2016 turns out to be a little cooler than the Met Office forecast, it is very likely that by this time next year the three warmest years since global measurements began will be 2014, 2015 and 2016, in some order or other. Continue reading

The quest for CCS

The quest for CCS

This article was originally published online at Corporate Knights and will appear in the hard copy Winter 2016 Edition of the Corporate Knights Magazine, which is to be included  as a supplement to the Globe and Mail and Washington Post later in January 2016. The photograph used in the original was changed for copyright reasons. Also reposted at Skeptical Science.

Human civilization developed over a period of 10,000 years during which global average surface temperatures remained remarkably stable, hovering within one degree Celsius of where they are today.

If we are to keep future temperatures from getting far outside that range, humanity will be forced to reduce fossil fuel emissions to zero by 2050. Halving our emissions is not good enough: we need to get down to zero to stay under the 2 C target that scientists and policy makers have identified as the limit beyond which global warming becomes dangerous.

Photo: rustneversleeps

Shell boasting about its government-funded Quest CCS project, on a Toronto bus.  “Shell Quest captures one-third of our oil sands upgrader emissions”

Many scenarios have been proposed to get us there. Some of these involve rapid deployment of solar and wind power in conjunction with significant reductions in the amount of energy we consume.

Continue reading

Alberta’s new carbon tax

Alberta’s new carbon tax

Originally posted at Skeptical Science on December 31, 2015

http://alberta.ca/documents/climate/climate-leadership-report-to-minister.pdf
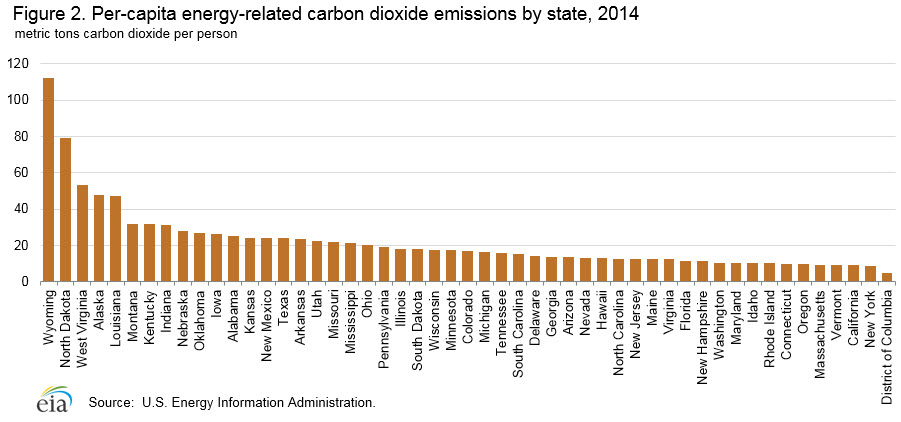
On Sunday November 22nd, 2015, Alberta’s new centre-left Premier, Rachel Notley, announced that the province would be introducing an economy-wide carbon tax priced at $30 per tonne of CO2 equivalent, to be phased in in 2016 and 2017. Observers had been expecting new efforts to mitigate emissions since Notley’s election in May 2015, but the scope and ambition of this policy took many by surprise.

Alberta, of course, is the home of the Athabasca oil sands and is one of the largest per-capita GHG emitters of any jurisdiction in the world. The new plan was nevertheless endorsed by environmental groups, First Nations and by the biggest oil companies, an extraordinary consensus that many would not have thought possible.

How was this done? I will try and explain the new policy as far as I can (the details are not all available yet), but the short answer is that a huge amount of credit is due to the panel of experts led by University of Alberta energy economist Andrew Leach and his fellow panelists. Not only did they listen to what all Albertans had to say, but they were thoughtful in framing a policy that is acceptable to almost everyone.

The background

Alberta is the wealthiest province in Canada, with a population of 4.1 million.  In 2013, greenhouse gas emissions were 267 Mt CO2 equivalent, about 65 tonnes per capita, which compares with the average for the rest of Canada of about 15 tonnes. Among US states only North Dakota and Wyoming are worse. Alberta’s fugitive emissions of methane alone amount to 29 Mt CO2e, about 7 tonnes per person, which is a little more than the average for all GHGs per-capita emissions in the world.

Continue reading