
- Since the introduction of the carbon tax in 2008, BC has achieved reductions in fuel use of 17.4% per capita and even greater reductions (18.8%) relative to the rest of Canada.
- During this period there has been a large increase in the number of Canadian vehicles crossing the BC border into the United States , especially for day trips. It is likely that the main purpose of many of these trips was shopping.
- The current rate of Canadians visiting the US is not unprecedented. Larger numbers of Canadians crossed the border in the 1990s.
- Although high gasoline prices are a factor in motivating the border crossings, there were many other incentives, for example, the strong Canadian dollar, as well as cheaper dairy products, clothing and electronic goods.
- On average, a Canadian vehicle crossed the border an additional 1.3 times per year in 2012 compared to the rate before the introduction of the carbon tax.
- It is estimated that 1-2% of the refined petroleum product fuel consumed in BC was purchased in the United States as a consequence of the additional cross-border travel. This amount of fuel does not therefore show up in Canadian fuel sales figures, which requires us to make small adjustments to the provincial fuel-use estimates. Nevertheless, the adjusted reduction in BC fuel use over the past four years still exceeds 15% per person per year.
- The BC carbon tax is an effective policy that has likely substantially reduced emissions, but has not harmed the economy. It is increasingly politically popular within the province.
Introduction
A recent peer-reviewed paper by Stewart Elgie and Jessica McClay estimates that consumption of the fuels subject to the BC carbon tax has fallen by 17.4% in absolute per-capita terms and by 18.8% relative to the rest of Canada, since the introduction of the tax in July 2008. I have previously written about the BC carbon tax in two articles published at Skeptical Science here and here (and reposted on this blog here and here).
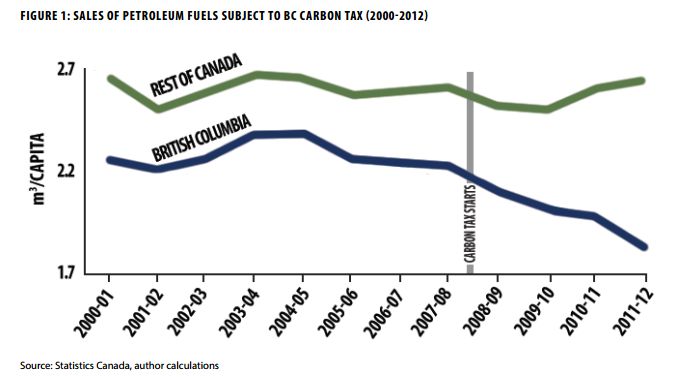
Figure 1. From Elgie and McClay (2013).
Commenters at Skeptical Science (see here) pointed out that at least part of the drop in fuel consumption could have been due to an increase in British Columbians crossing the US border and filling up their vehicles there. The statistics on same day return trips by Canadians across the BC/US border indeed do show a marked increase since 2008. Anecdotal evidence suggests that Canadians do generally fill up their vehicles in the US before recrossing the border (I have always done this on my car trips to the US over the years), so there is at least a prima facie case to be made that an increase in trips across the border will be reflected in a decrease in fuels sales in Canada, other things being equal. Some commentators, such as Elizabeth Nickson, writing in the Vancouver Sun, claim that the reduction in sales is entirely due to cross-border shopping. I will show, that this is not possible.
Elgie and McClay did not address the question of cross-border fuel purchases in their paper, but Nicholas Rivers and Brandon Schaufele did in their working paper (rumoured to be coming out soon as a peer-reviewed publication) Carbon Tax Salience and Gasoline Demand. Their paper is concerned with the magnitude of the drop in demand for fuel in BC caused by the carbon tax. They make some suggestions to explain why the drop in demand is greater than would be expected from theory. They downplay, but are unable to dismiss, the effect of cross-border shopping:
The first alternative explanation is that the carbon tax coefficient is actually capturing a cross-border shopping effect. Higher prices due to the carbon tax may have encouraged drivers to begin filling their gas tanks in neighbouring jurisdictions. We are unable to dismiss this explanation, yet believe that it is unlikely. Alberta is to the east of BC, while Washington State is to the south. Both jurisdictions have had lower gasoline prices than BC for many years, including a lengthy period prior to the introduction to the carbon tax (refer to Panel B in Figure 1). Further, over 95% of BC’s population would need to drive more than two hours to reach the Alberta border, while crossing into Washington involves an international border. It is doubtful that a sizeable share of residents suddenly began cross-border shopping because of the carbon tax. Nonetheless, this is a potential alternative explanation for our findings.
Rivers and Schaufele make no attempt to quantify the effect of cross-border shopping on sales of fuels in BC. Canadians who fill up their vehicles more often in the US will reduce reported fuel sales in BC, regardless of their motivation for making the trip. To argue that the the carbon tax is not the main effect driving shoppers across the borders does not diminish the effect that those shoppers will have on fuel sales in BC.
Approximately 2.6 million people in BC—about 55% of the population—live in the Lower Mainland, within approximately 50km of the US border. Only a small number of BC residents live within an hour’s drive to a gas station in Alberta. There are, anyway, no statistics on BC-Alberta border crossings. For practicality, I’ll assume that any increased traffic across provincial borders within Canada over the past few years is small.
Border crossings in perspective
All the data on US-Canada road border crossings used here comes from StatsCan’s Table 47-0002, which comprises monthly data of entries into Canada broken down by the nationality and type of the vehicle, the province of entry and the length of stay. The data go back to 1972. These data are very seasonal, with the number of crossings in the summer being much higher than in winter. To remove this effect, I have summed six months before and six months after a given date for plotting the graphs below. This also means that any non-seasonal blip in a given month will get smoothed over a year.

Figure 2. Entries into Canada for the whole of Canada (blue), Ontario (red) and BC (green). Annual figures.
Canadian travellers are shown with dashed lines, Americans are dotted, both added together are shown in solid lines.
The graph shows a number of features.
- Historically, the busiest time for border crossings by Canadians was in the early 1990s.
- Canadians tend to cross the border more when the Canadian dollar is relatively strong (the 1990s and now) and Americans cross more when the Canadian dollar is weak (1996-2006).
- Events like the 9/11 World Trade Center attacks can bend the curves, as can economic crises, like the Great Recession.
- Generally, more Canadians visit the USA than Americans visit Canada, this is especially true since 2004.
- Border crossings in BC are disproportionately large compared to the rest of Canada, considering that the population of BC is only 13% of the whole country’s. Ontario has three times the population of BC , but less than twice the number of Canadians cross Ontario/US borders. This is probably due to the close proximity of more than half of BC’s population to the border.
- There has been an uptick in the number of Canadians visiting the US from all parts of Canada since 2009. However the increase is proportionally highest in BC, where the number of Canadians crossing the border has more than doubled in this time, whereas in Canada and Ontario the increase over this period has been about 30-40%.
Figure 2 shows that motivations to cross the border may be influenced by economic and other influences But it is the doubling of Canadians crossing the BC border that is of interest with regard to the introduction of the carbon tax in mid 2008. Two distinct questions need to be answered:
- What role did the carbon tax play in motivating people to cross the BC border?
- Regardless of the causes of the extra crossings, what effect does the increased border traffic have on sales of gasoline and diesel fuel in BC?
Neither of these questions can be given a definitive response, but it is at least possible to estimate an answer to the second one.
1. The carbon tax as a motivator for cross-border shopping
The BC carbon tax adds CAD 0.067 to each litre of gasoline, about USD 0.25 per gallon. According to the website GasBuddy, current prices in Vancouver are about CAD 1.42 per litre, approximately USD 5.20 per US gallon. In NW Washington State, prices in Blaine (on the border) are USD 4.03 and in Bellingham, some twenty miles further down the road, the prices are USD 3.65. So, an 18 gallon fill-up would save between USD 21.00-28.00 relative to Vancouver prices. Of this, just USD 4.50 is directly attributable to the carbon tax. Therefore, even looking only at gasoline prices, the carbon tax is only a small part of the story. In the Vancouver area, carbon taxes are only contribute one-fifth of the total CAD 0.32/litre provincial tax on gasoline (see page 5 of this pdf).
Canadians are going shopping in the US for reasons other than just gasoline prices:
The director of the Center for Economic and Business Research at Western Washington University, Hart Hodges, says cheaper prices in the U.S. for clothes, dairy products, gasoline and airfares are a big lure.
“It’s a little bit surprising that we have seen so much of an increase given that the Canadian economy is slowing. But it’s slowing from the Canadian dollar being above par back to roughly par or 95 cents U.S. That’s still very, very strong.”
Hodges called out burgeoning Bellingham International Airport as another factor to explain the uptick in cross border traffic. In March, the airport set a new passenger record, driven by new flights which cater to Canadian bargain seekers. Residents of southwest British Columbia have long complained about high airfares at Vancouver International Airport. Bellingham’s airport is roughly 20 miles south of the border.
Note that international airfares out of Vancouver are not high because of the carbon tax, because jetfuel is exempt from the tax for out-of-province flights.
Milk, in particular, seems to be a favourite item of cross-border shoppers, since prices vary significantly because the US Government subsidizes consumers, while Canadian consumers subsidize producers through “supply management“. As an example, just watch the milk vanish off the palette in this video recorded at the Bellingham CostCo supermarket. American customers of the Bellingham CostCo even have their own Facebook page, where they complain about all those rude Canadians invading their country, driving and parking badly and elbowing their way to the dairy counter.
In short, although evading the carbon tax on gasoline is only a small part of the incentives for British Columbians to shop in the US, it is still a factor. The carbon tax, after all, was introduced expressly to modify consumer behaviour, even if not exactly in this way.
2. How much fuel consumed in BC was bought in the US?
The difficulty in quantifying cross-border fuel purchases is that the only variables we have reliable statistics for are the numbers of vehicle trips across the US-Canada border. To convert these border crossings into a quantity of net litres of fuel carried northwards involves making assumptions about: a) what kind of vehicles people typically drive; b) how full their fuel tanks are when going south and; c) how full they are when they headed north again. The best we can do is to try and bracket the estimate. First, let’s look in more detail at the border-crossing statistics. All data are from Statistics Canada Table 427-0002.
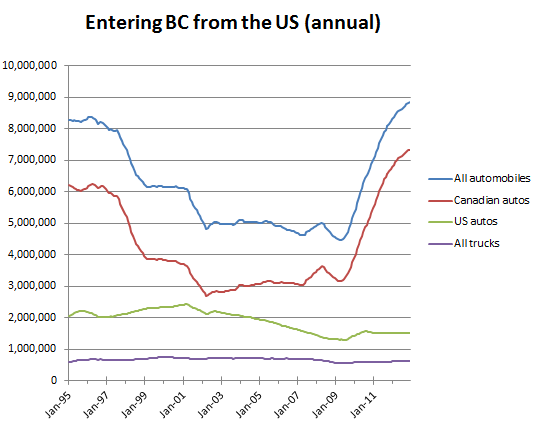
Figure 3. All automobile entries from the US into BC, plus all trucks. Annual figures. Source: Statistics Canada.
The graph above shows that since 2007-2008, the main category that varied significantly was the number of Canadian automoblies entering BC from the US. The number of American vehicles crossing the border fluctuated only a little. The truck traffic was steady. We’ll focus, from now on, just on the Canadian automobile traffic.
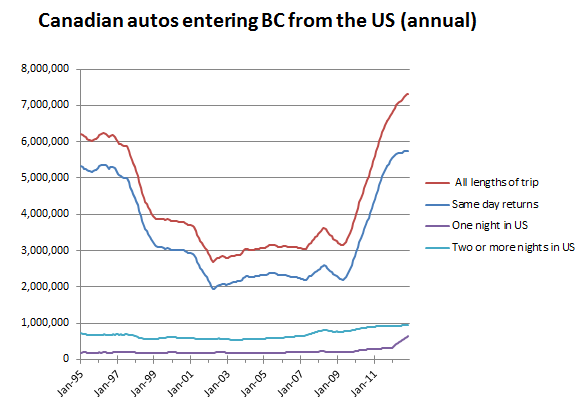
Figure 4. Canadian automobile traffic entering BC from the US, broken down by the length of stay in the US. Annual figures. Source: Statistics Canada.
The main variable category here is the day trippers, who more than doubled in number in the past few years. The Canadians who stayed for one night also rose rapidly in the past year. For the rest of the analysis, I will just look at the border crossing represented by the red line: the total number of Canadian automobiles that crossed the border that were returning from trips of any length. Over the period from July 1 2007 to June 30 2008, the number of cars crossing was 3,500,955. For the same months four years later, 2011-2012, the numbers were 6,857,513. This amounts to an increase of 3,356,558 extra cars crossing the border annually, four years after the introduction of the carbon tax.
There are approximately 2,600,000 light vehicles on the road in British Columbia (Statistics Canada). This means that each vehicle, on average, crossed the border 1.3 times more often in 2011-2012 than in 2007-2008. If we assume every car that entered the US filled up with with gas, and that the typical car fills up once per week (the average car in BC is driven for 13,000 km per year, Statistics Canada)’ this would amount to 1.3/52 = 2.5% fewer fill-ups recorded in BC in 2011-2012. We might assume, then, that 2.5% more fuel was purchased in the US but used in BC after four years since the carbon tax was introduced.
The total Refined Petroleum Products (RPP) amount subject to the carbon tax, used in Elgie and McClay’s Figure 1 above, was 8,580,9321 cubic metres in 2011-2012 (Stewart Elgie, personal communication). Of this, gasoline amounts to 4,084,608 (48%) and diesel 3,234,926 (38%) cubic metres. There are relatively few light vehicles that use diesel in North America, current sales are about 3%– 4%. For the sake of the calculations here, let’s assume that diesel-fuelled light vehicles use 10% of the diesel fuel in BC. This means that some 7,320,000 cubic metres of gasoline and diesel was used for light vehicles in BC in 2012, about 51% of the volume of the RPP. This implies that an apparent reduction of 2.5% in BC light-vehicle fuel use (due to purchases being made in the US) would represent a 1.3% (=0.51 x 0.025) apparent reduction in consumption of all refined petroleum products. If the lower line in Figure 1 was revised upwards to account for the extra fuel purchased in the USA in 2012, the new line would be higher by less than one line thickness on that graph. Quite clearly, the effect of cross-border shopping for fuel is only a small factor in the reported reduction in sales of all fuels in BC.
Let’s try estimating US gas purchases using some different assumptions. There is a unknown mix of vehicles that cross the border and the range of vehicle classes in N America is very large, from small compact cars that have low fuel consumption and small gas tanks to larger SUVs and pick-up trucks that use more fuel and have larger tanks. What does not vary as much is the range of a given vehicle; how far it can drive on a full tank without refuelling. The website Automobilemag.com has specifications for many vehicles driven in N America, including the vehicles’ ranges and the size of their gas tanks. Typically, range varies between 280 and 410 miles, with as much variation within vehicle classes as between vehicle classes. Let’s assume, for our first calculation, an average range of 350 miles, or 563 km.
Fuel tank capacities vary much more, from 10 US gallons for a small car to 26 gallons or more for a pick-up truck. We’ll assume, for our second calculation, an average fuel tank size of 18 US gallons, or 68 litres.
It would be unwise to assume that every vehicle that goes south across the border has an empty tank and that every vehicle heading north has a full tank. For example, there are commuters who cross the border on a daily basis—I know a couple who live in Blaine WA and commute each day to Vancouver—and who surely do not use a full tank of gas per day. It is not easy to time your trip exactly so that the fuel gauge is exactly on empty when you drive on to the forecourt of the first US gas station. And if you fill up at the Bellingham CostCo, you will use up a gallon or so before you get back to the border.
I will also assume two cases for each calculation method. In the minimum case we assume that the average driver leaves BC with one-third of a tank and returns with two-thirds of a tank of fuel. The maximum case assumes that the average person leaves Canada with a quarter-full tank and returns with a completely full tank. For the minimum case, I multiply the vehicle range or the tank capacity by 0.33 and for the maximum case, 0.75. Let’s call these the “fill factors”.
The first method allows us to estimate the distance driven on BC roads using US fuel. For the maximum fill-factor case this would be 563 km x 0.75 for every one of the additional 3,356,000 light vehicle border crossings by Canadians in 2011-2012, compared to four years earlier. This amounts to 1.4 billion km of the total 33.3 billion km driven in BC, about 4.2 %. The minimum case, using the lower fill factor, would be 1.8%. Now, if these amounts translate directly into fuel use and, allowing for the proportion of light vehicle fuel in the RPP total, this computes to a range of 0.9 to 2.1% reduction in overall fuel use.
The second method yields 68 litres x 0.75 x 3,356,000 fill ups or 171,500 cubic metres of fuel, approximately 2.0% of the RPP total for the maximum fill-factor case. The minimum case would be 0.9%.
To sum-up, we have estimates of the cross-border effect on reported fuel use calculated three different ways:
a) 1.3% (assumed proportion of extra fill-ups per year in the US)
b) 0.9 – 2.1% (based on the average driving range on a full tank)
c) 0.9 – 2.0% (based on average fuel-tank sizes)
This means that given the uncertainties involved, I would say, in round numbers, that cross-border shopping accounts for about 1 – 2% more fuel use in BC than is reported by domestic sales figures in 2011-2012 compared to sales reported four years earlier. That is only a small part of the 17.4% percent drop in absolute per-capita fuel use and the 18.8% drop in fuel use relative to the rest of Canada, over the same time period reported by Elgie and McClay.
The rest of Canada also indulged in increased cross-border shopping over this same period—despite the absence of a carbon tax anywhere else—so their fuel-use figures may also be slightly under-reported. This correction will be smaller than the BC adjustment, however, and I have not attempted to calculate it.
But these are my best estimates only and, as the disclaimers in the TV car commercials say: your mileage may vary. However, to claim that cross-border fuel purchases account for all of the observed decrease in fuel consumption in BC, as some have done, the volumes involved would have to be nine times larger than my biggest estimate, which is not feasible.
Conclusions
Although the amount of cross-border shopping produces a relatively small effect on reported fuel consumption, it does point to the limitations that any jurisdiction within a free-trade area has in being able to determine its own tax policy without causing some tax leakage. If Washington State, in particular, were to introduce fuel taxes similar to BC’s, much of this leakage would go away. But there are limits to how far BC can raise its taxes on carbon without introducing border tariffs or import restrictions. Implementing those would not only be problematic within the NAFTA agreements, but, even it were possible, restricting the flow of goods across the border would cause harm to the economy.
BC’s carbon tax is a bold experiment that seems to be working well, and working without harming the economy. Perhaps the most unexpected feature of the tax is that is proving popular, with opinion polls showing increasing support. Climate sceptics should take note: it is possible to reduce carbon emissions without causing economic harm. And politicians everywhere should be aware that introducing carbon taxes can be a winning proposition.
Comments and corrections would be appreciated.

Pingback: Is this man the greenest governor in America? | Grist
Pingback: WATCH: Is This Man the Greenest Governor in America? | nuzreal.com
Pingback: The Canadians Are Coming! | Sightline Daily
One statistic that has not been cited is WA state gasoline consumption, available here:
http://www.eia.gov/state/seds/data.cfm?incfile=/state/seds/sep_use/tra/use_tra_WA.html&sid=Washington
The upshot: WA state gasoline sales decreased from 63,583 thousand barrels in 2009 to 61,274 kbarrels in 2012. And, to cross-check further, WA’s population (US census data) in the same period went from 6,724,540 to 6,895,318.
These data sets are running in the wrong direction if BC cross-border gasoline sales were as large as claimed…
Thanks Ian, I hadn’t looked at those numbers.
You may be interested in Yoram Bauman’s method of looking at this. He looked at the number of gas stations in WA counties near the border. He came to more or less the same answer as me.
http://daily.sightline.org/2014/05/21/the-canadians-are-coming/
current oil price volatility is offsetting the carbon tax effect on emissions, nowadays, dotn you think so?
Clearly, yes, the halving of crude oil prices over the past couple of years will swamp any price effect of a $30/tonne carbon tax, which adds about 7 cents per litre at the gasoline pumps. There is bound to be an uptick in fuel consumption—and an increase in emissions—as a result of the price fall.