
The huge El Niño of 2015-2016 has now ended and global surface temperatures are now declining very quickly. In fact, the global temperature anomaly fall from February-May 2016 was 0.40°C; the biggest three-month decline since November 1928-February 1929 (0.48°C). Even the times of big volcanoes like Pinatubo did not see such rapid declines over any three-month period. This is surely a result of the extraordinary intensity of the now-departed El Niño.

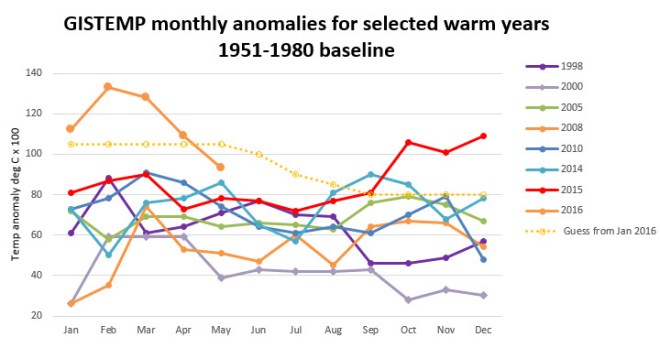
Despite the rapid decline, May 2016 was the warmest May in the temperature record and had the highest temperature anomaly for any month in the record prior to October 2015. [Edit, this is not right, actually it was the second highest; January 2007 recorded an anomaly of 0.96 degrees, h/t Sou.] Nevertheless, the period of extraordinary record-breaking monthly records could well be over soon. All of the temperatures shown in this post are NASA’s GISTEMP data.
The May figures are now below my guesswork projection for 2016. In order to simply match the annual 2015 record, temperatures would have to average 0.65°C for the rest of the year. [Note, I made a stupid computation error in the first published draft of this post, now corrected. Apologies for the confusion.]
The average-to-date for 2016 is now 1.15°C, but with a declining trend now established and a La Niña probably on the way, it’s very unlikely that we will exit 2016 with an annual anomaly that high.
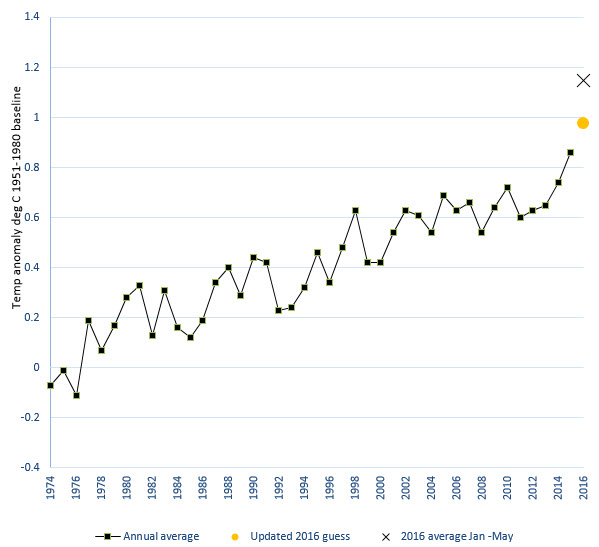
Using my guesswork forecast for the rest of the year would produce an annual anomaly of 0.98°C, a substantial increase over the 2015 record of 0.86°C.
Here’s a cross-plot of January-May averages for every year versus annual mean temperatures for the period 1950-2016. Using the linear regression line allows us to predict an annual anomaly of 1.08°C. That’s a little lower than the January-May average of 1.15°C, because the slope of the graph is a little less than one, probably due to the fact that the temperature boosts provided by El Niños tend to come in the early part of the year.
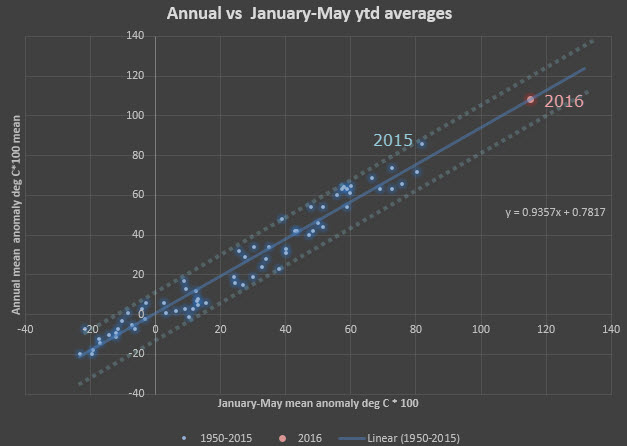
The dashed lines are drawn parallel to the trendline and give an impression of the uncertainty in making such a projection, roughly plus or minus one tenth of a degree C.
In previous months, I did the analysis on the entire 1880-2015 dataset. This produces a lower prediction of 1.06°C for 2016. This is shown below for comparison purposes.
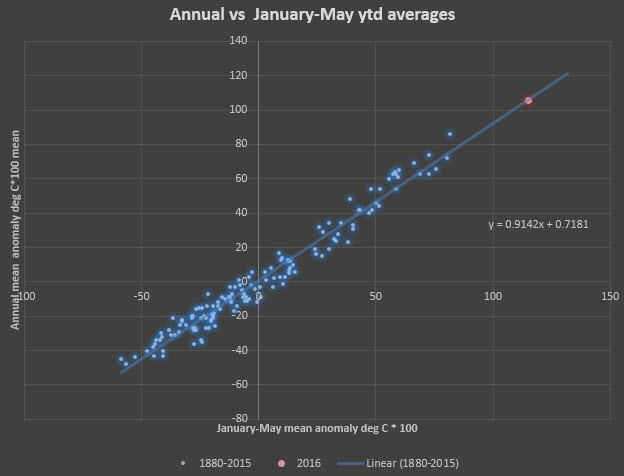
Including only the modern era of rapid anthropogenic interference with the atmosphere since the Great Acceleration after 1950 makes little difference to the prediction. Setting of a new annual temperature record for 2016 is almost certain.
Here is NASA’s map of the distribution of global temperature anomalies:
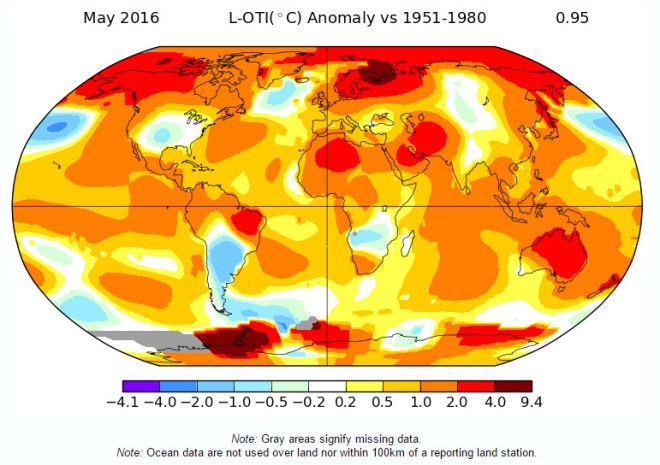
Self-appointed Climate Auditors may already have noted with confected concern that the global average number in the top right-hand corner of this map, 0.95°C is higher than the the 0.93°C anomaly reported in the downloadable data tables. I’m guessing that this is a typo and the higher number comes from an estimate made before finalization of the month’s results.
The global patterns are quite similar to April’s with a few cooler spots in the USA and east-central Siberia. Hudson’s Bay is now warmer, as is the Antarctic peninsula.
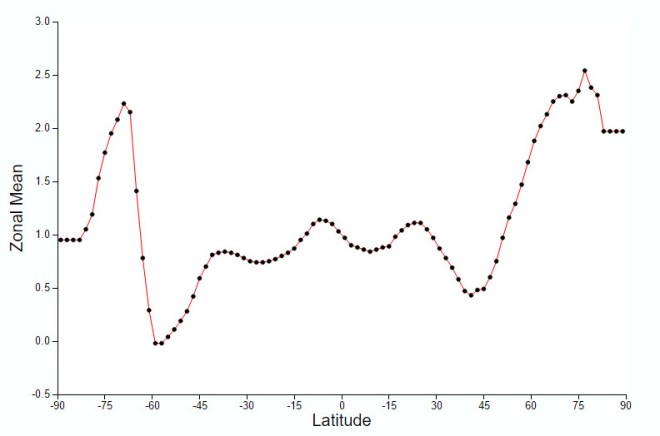
The distribution of anomalies by latitude shows high-latitude amplification, as usual, with some cooler bans at mid latitudes in both hemispheres.
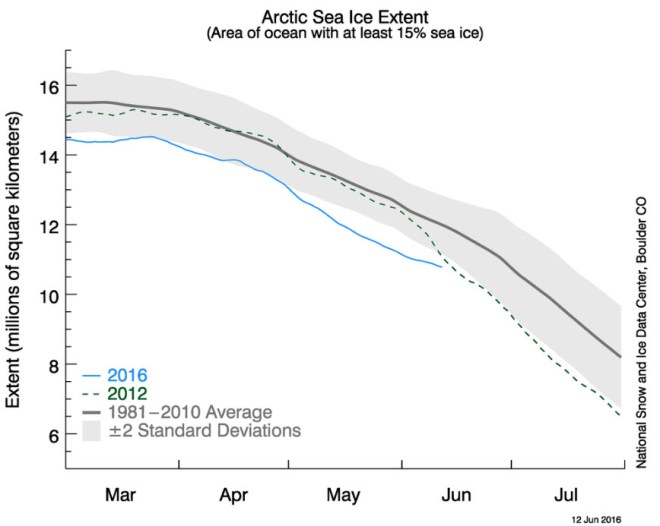
Arctic sea ice is still showing a record low, but only just as 2016 appears to converge with the all-time record year of 2012. However, NSIDC reports some problems with the satellites it uses and says that these results are “tentative”. A new low Arctic sea-ice record for 2016 is possible, but is far from certain.

Pingback: ¡Hasta la vista, el Niño! Surface temperature update for May 2016 – Enjeux énergies et environnement