
This was first published at Corporate Knights. I have added in this re-post some footnotes with details of calculations along with comments and references below the main article. I have also done a rough estimation of the emissions associated with the addition of one 18 million tonne per year LNG project (excluding end-use emissions) and the effect that this will have on BC’s emissions targets.

Photo by Jesús Rodríguez Fernández (creative commons)
The push by British Columbia to develop a new liquefied natural gas (LNG) export industry raises questions about the impact such activities would have on greenhouse gas emissions, both within the province and globally.
One of the single most important factors relates to the amount of methane and carbon dioxide that gets released into the atmosphere, either deliberately through venting or by accident as so-called fugitive emissions. Fugitive emissions are the result of valves and meters that release, by design, small quantities of gas. But they can also come from faulty equipment and from operators that fail to follow regulations.
According to the B.C. Greenhouse Gas Inventory Report 2012, there were 78,000 tonnes of fugitive methane emissions [1] from the oil and natural gas industry that year. B.C. produced 41 billion cubic metres of gas in 2012 [2]. This means about 0.28 per cent of the gas produced was released into the atmosphere [3].
By North American standards, this is a very low estimate. The U.S. Environmental Protection Agency (EPA) uses a figure of 1.5 per cent leakage [4], more than five times higher. Recent research led by the U.S. non-profit group, Environmental Defense Fund (EDF), shows that even the EPA estimates may be too low by a factor of 1.5 [5]. B.C.’s estimate, in other words, would be about one-eighth of what has been estimated for the American gas industry.
Although the amounts of methane released are small compared to carbon dioxide emissions, methane matters because it packs a much bigger global warming punch. Determining the effect of methane emissions is complicated because molecules of methane only last in the atmosphere for a decade or so and the warming effect from its release depends on the time interval it is measured over. Compared to a given mass of carbon dioxide, the same mass of methane will produce 34 times as much warming over 100 years, or 86 times as much over 20 years [6].
There are reasons why B.C.’s methane emissions might be low relative to American operations. Much of the conventional natural gas in B.C. is sour – that is, it contains hydrogen sulphide in small but dangerous concentrations. The need to handle this gas with great care before it is processed has produced strict regulations and a culture of compliance among operators. In addition, B.C. does not have the ancient and often leaky iron pipes installed as much as a century ago to distribute gas in some U.S. cities. Nevertheless, differences in the industry practices between the two countries are likely insufficient to explain the factor-of-10 variance in leakage estimates.
The B.C. government estimates its fugitive emissions by using a combination of inventory methods and detailed field reporting from industry. Inventory methods involve taking, for example, the expected leakage from a certain type of valve and multiplying that factor by the number of such valves employed in the field. The reports provided by industry record emissions from combustion, leaks and venting of all greenhouse gases. These two methods are known as bottom-up approaches and they depend on equipment working as designed and on the operators fully reporting emissions.
Entirely lacking in B.C.’s approach, however, are so-called top-down measurement approaches that the EDF researchers have used in the United States. These techniques measure the methane concentrations in the atmosphere around gas industry operations, using sensors mounted on towers as well as on ground and airborne vehicles.
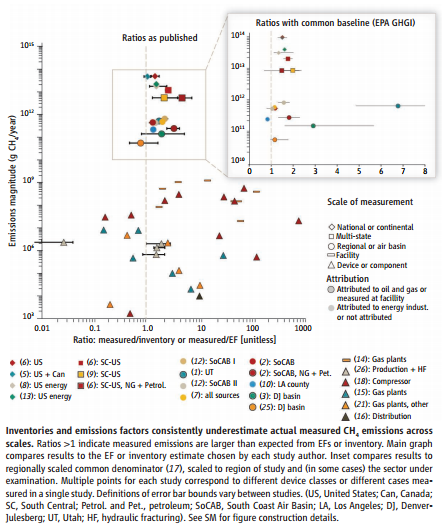
A major 2014 survey by Stanford professor Adam Brandt and colleagues in the journal Science shows that top-down methods almost invariably reveal more emissions than the bottom-up, inventory methods. One important reason for the discrepancy seems to be the presence of “super-emitters” – for example, unreported leaks from pipelines or rogue operators flouting regulations. One study found that 58 per cent of emissions came from merely 0.06 per cent of the possible sources.
A recent Canadian example of a super-emitter would be the operations of Murphy Oil, which was recently shut down by the Alberta Energy Regulator. The regulator conducted an unannounced compliance sweep and discovered that U.S.-controlled Murphy, contrary to regulations, was allowing associated gas produced with their oil operations to vent to the air rather than be flared or conserved.
Another example would be a recent spill of 31,500 barrels of bitumen in the oil sands of northeastern Alberta at a project operated by Nexen, now owned by the Chinese company CNOOC. Despite use of the latest technology, the leak went undetected perhaps for as long as two weeks until, by chance, a contractor spotted it. If this had been a leak from a gas pipeline in a remote area of B.C., it would have been far harder to detect by casual inspection.
Wanted: credible numbers
EDF funded its $18 million, 16-study methane-leak research program with grants from private and industry donors, including a large one from the Cynthia and George Mitchell Foundation. George Mitchell is widely credited as one of the pioneers of gas-fracking technology. Two industry donors to the EDF project were Canadian companies Encana and TransCanada Corporation, both active in the B.C. natural gas business. The EDF research project involved the participation of industry, universities, environmental non-profit organizations and government agencies.
 Environmental scientist Ann-Lise Norman of the University of Calgary has estimated that a top-down methane measurement research program in B.C. would cost less than $10 million. Complementary studies and audits could also be conducted at relatively low cost. The time to start any such studies is now, since they would provide an emissions baseline prior to the greatly expanded development activity that will happen once the B.C. LNG projects get underway.
For any study in B.C. to be as credible as counterparts in the U.S., the participation of industry, government, university researchers and environmental groups would be required.
Transparency is a must because the current B.C. government is an unabashed cheerleader for the LNG industry while the provincial regulator, the B.C. Oil and Gas Commission, has been described by journalist Andrew Nikiforuk as more of an industry funded and controlled facilitator rather than what it ought to be: an independent watchdog and an arbiter between the industry and the people of the province. For example, the B.C. regulator could, following the recent lead of its Alberta counterpart, step up compliance sweeps. Unfortunately, it has shown no inclination to do so.
Canada’s energy industry has in recent years gained a tarnished international reputation due to well-publicized pipeline failures and the scrutiny given to production practices in the oil sands. The U.S. has taken seven years to examine the Keystone XL pipeline application, and approval is still not granted or assured. The European Union wanted to label oil sands bitumen as “dirty oil” and impose extra taxes untilpressure from the Canadian government on some EU states forced them to back down.
The customers for Canada’s energy exports are not likely to be persuaded any longer by blithe assurances that the country’s energy products are clean or ethical. No longer, after what is shaping up to be the hottest year on record, can we assume that the buyers of Canada’s energy exports will be indifferent to the upstream emissions involved in making that product.
Many countries will be making difficult commitments to reduce their emissions at the Paris climate conference in December. They will not look kindly upon trading partners who are set to break their own domestic commitments and who show little inclination to properly measure and manage their emissions.
Three years ago at the World Economic Forum in China, B.C. Premier Christy Clark claimed that British Columbia would produce “the cleanest LNG in the world” – a promise that was later redefined to exclude greenhouse gas emissions associated with the production, processing and overland transportation of the gas.
In contrast, the Gorgon LNG project in Australia – a competitor to B.C.’s gas in Asian markets –disposes of four million tonnes per year of excess carbon dioxide at its processing and liquefaction site by injecting it deep into geological reservoirs, significantly reducing the overall emissions of the LNG process, from wellhead to ship.
Other things being equal, and in an over-supplied Pacific market, LNG customers may prefer suppliers with a genuine and demonstrable claim to producing the cleanest LNG in the world.
I have “archived” BC Government publications because the URLs tend to get changed over time and superseded documents are sometimes removed from the government websites altogether.
Footnotes to the Corporate Knights piece
As always, I will be grateful for readers to point out any errors I may have made.
- “78,000 tonnes of fugitive methane emissions” from British Columbia Greenhouse Gas Inventory Report 2012 Table 3, page 14. Archived here
- “41 billion cubic metres per year” That is “Wellhead Gas” from the spreadsheet “Production and Distribution of Natural Gas in B.C. BC Gov Industry site Archived here click on “gasnew original” to download the spreadsheet.
- “0.28 per cent of the gas” I converted the mass of gas (78 kt) to volume using a methane density of 0.678 kg/cubic metre to give 115 million cubic metres. This volume divided by 41 billion cubic metres yields 0.28%. For 2013 the fugitive emissions of methane are 68 kt and the wellhead production was 45 million cubic metres, yielding a leakage rate of 0.23%. The 2013 production is given in the reference in 2 above and the 2013 emissions from the spreadsheet “Summary of GHG Emissions 1990 – 2013” on this BC Gov Environment site. Archived here The density of natural gas depends on temperature, pressure and the variable amounts of other, heavier, gases like ethane. I used a density of 0.678 kg/cubic metre to be consistent with the BC Environment Ministry (see here).
- “The U.S. Environmental Protection Agency (EPA) uses a figure of 1.5 per cent leakage” See Hausfather (2015): “According to EPA inventories, total emissions of fugitive methane have declined since 2005 despite a rapid expansion of unconventional natural gas production over the past decade, with total leakage of approximately 1.5 percent of production by mass in the 2012 inventory report.”
- “EPA estimates may be too low by a factor of 1.5.” Brandt et al (2014): “This excess is conservatively defined as 1.25 to 1.75 times EPA GHGI estimates.”
From Brandt et al. (2014)
- “Compared to a given mass of carbon dioxide, the same mass of methane will produce 34 times as much warming over 100 years, or 86 times as much over 20 years.” See the table below from the 2013 IPCC AR5 WG1 Chapter 8. Note that BC has used a methane GWP100 (Global Warming Potential over 100 years) of 21 up to 2012 and 25 from 2013 onwards; these figures are consistent with UNFCCC reporting protocols, even though they lag the current science.

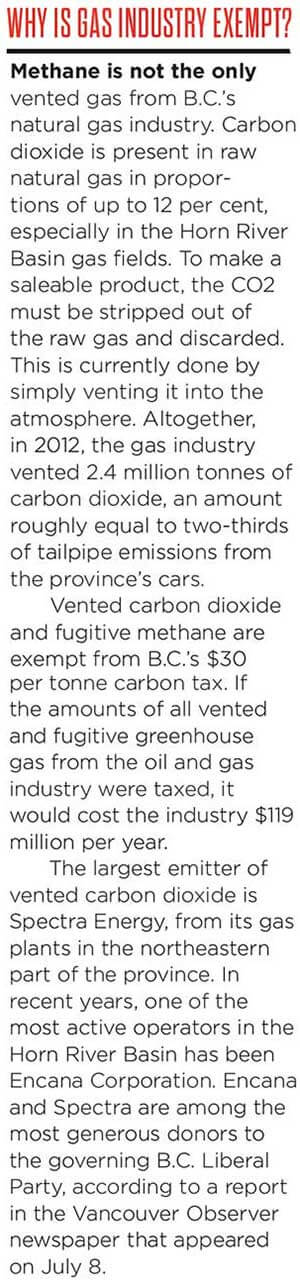
- From the sidebar: “Altogether, in 2012, the gas industry vented 2.4 million tonnes of carbon dioxide, an amount roughly equal to two-thirds of tailpipe emissions from the province’s cars.” See the reference in 1 above. Vented emissions of 2350 kt of CO2 from oil and gas operations are 68% of the 3466 kt of CO2 from “Light-Duty Gasoline Vehicles”.
- “Encana and Spectra are among the most generous donors to the governing B.C. Liberal Party, according to a July 8 report in the Vancouver Observer.”

Vancouver Observer http://www.vancouverobserver.com/news/alberta-oil-and-gas-millions-fuel-bc-liberal-machine?page=0,1
- “If the amounts of all vented and fugitive greenhouse gas from the oil and gas industry were taxed, it would cost the industry $119 million per year.” According to the reference in 1 above, Fugitive and vented emissions from oil and gas operations in 2012 amounted to 3,983 kt CO2e. From the reference given in 3 above, 4,277 kt CO2e were emitted in 2013, which at $30/tonne amounts to a forgone carbon tax for that year of $128 million. (Note that “forgone” carbon taxes are not a loss to the BC Treasury because the tax is revenue-neutral. Rather, the uncollected taxes represent a transfer from low-emission persons and businesses to the high-emission petroleum industry, compared to the case of a carbon tax in which all emissions were taxed equally.)
Effect of larger leaks and LNG projects on BC’s emissions targets
The point of my Corporate Knights article is that we don’t yet truly know what BC’s fugitive leakage rate is and we had better find out. What follows is a back-of-the-envelope estimate of what emissions would be if: A) we scaled up BC’s methane leaks to 1% of overall production (which is at the extreme low end of the often-quoted US range of 1-5%); B) gas production in BC were scaled up to feed one 18 Mt per year LNG project (the size of the proposed Pacific NorthWest LNG project); C) we include an estimate for the CO2 released in the gas liquefaction process; and D) an increase in the combustion emissions in the scaled-up upstream operations.
A) If 2013 methane leaks of 68 kt (see footnote 3 above) representing 0.23% of production were instead 1% of production, the methane leakage would be 302 kt for 2013. At a GWP of 25, that gives 7,550 kt CO2e (about double the current CO2e emissions from BC’s cars). Added to the 2,580 CO2e vented from the BC upstream gas industry, this yields a total fugitive plus vented emissions total of 10,100 kt CO2e (about two-thirds of all emissions from BC’s road transportation) an increase of 5,800 kt CO2e above the current government estimate of 4,300 kt. Revising the emissions in this way would require that past emissions also be revised upwards. Because emissions targets are set to percentages of 2007 levels, this would not necessarily make hitting emission reduction targets harder, since the baseline would also shift. However, the absolute levels of emissions would rise substantially, with roughly $300 million per year in forgone carbon taxes, since these non-combusted emissions are exempt from it.
B) The Pacific NorthWest LNG project is the most advanced of some twenty proposed LNG projects in BC. The plan is to ship some 18 million tonnes of LNG per year on this project alone. This amounts to an additional ~25 billion cubic metres of annual gas production. In addition (see C, below) an additional ~9% of the shipped mass of LNG is required to be consumed in liquefying the gas at the LNG export plant. This means, roughly, a 60% increase from current upstream gas production levels to feed the one LNG project. Assuming a proportional increase in fugitive and vented emissions, this would mean that, by adding an LNG project, fugitive emissions would rise to ~16,000 kt CO2e per year, an increase of ~6,000 kt above the 2013 estimate in A), for an assumed 1% methane leakage rate.
C) LNG plants typically emit 0.22 to 0.42 tCO2e/tLNG. (KPMG report) by burning some gas to power the system that liquefies the gas to be exported. Assuming the low value, this would produce 3,960 kt CO2e emissions for an 18 million tonnes/year LNG project. The BC Government has an incentive plan in place to encourage the operator to reduce the emissions intensity below 0.16 tCO2e/tLNG, but it remains to be seen if this is achievable. These emissions will be subject to the carbon tax, plus an additional offset cost for emissions above the target intensity.
D) The upstream oil and gas industry currently emits (see references in 3 above) 6,899 kt CO2e in taxable combustion emissions. This includes an unspecified amount of combustion emissions from mining; let’s assume the fossil fuel share is 90% of that. An increase of 60% of industry activity would yield an additional ~3,730 kt CO2e.
Summing up and rounding figures to the nearest million tonnes, a single LNG project when we assume that methane leakage rates are 1% would add some ~6,000 kt CO2e fugitive emissions (B), plus ~8,000 kt CO2e (C+D) in combusted emissions, roughly 14 million tonnes of CO2e in total. The emissions and the emissions baseline would also be shifted upwards (A) by ~6,000 kt CO2e.
BC’s legislated emissions reductions are shown in the graph below. This implies some 18 million tonnes of CO2e reductions in the provincial economy from 2013 to 2020. If we add 14 million tonnes of additional emissions from a single LNG project, the reductions required become 32 million tonnes. In other words, we would then have to more than halve the emissions elsewhere in BC over the rest of this decade to reach the legislated target in 2020. That’s not credible.

Annotation added on the right of the graph to an original figure from page 4 of this report: http://www2.gov.bc.ca/assets/gov/environment/climate-change/policy-legislation-and-responses/2014-progress-to-targets.pdf
It’s still possible that a combination of: deployment of carbon capture and storage in the upstream; improved practices in the field; increased monitoring by the regulator; and powering the LNG plant with renewable energy could reduce the estimated 14 million tonnes of additional emissions considerably. But no such plans are on the table, not least because they will cost money and the economics of LNG are already severely strained. As this Oxford Institute for Energy Studies report estimates, Canadian LNG will require a price of US$10-12 per MMBtu to break even, whereas current Asian prices are a little below $8 MMBtu. Asian natural gas prices are linked to Brent oil prices, which would have to rise above US$80 per barrel before Canadian LNG started to be profitable. Furthermore, the BC Government has committed to the likely operator of the first LNG project to not imposing further taxes or “rules on greenhouse gas emissions that cause the company financial pain”. over the next 25 years. This means that further financial or regulatory incentives to reduce emissions are effectively ruled out.
It is also possible that actual methane leaks are closer to the government’s 0.23% estimate (2013) than my assumed 1%. Even if the methane leakage rate does turn out to be 0.23% (the value reported for 2013), then total well-to-ship GHG emissions for an 18 Mt/year LNG plant will still be a little above 10 Mt CO2e per year.
On the other hand, in my assumption of 1% leakage I have been conservative relative to the better-studied American gas industry observations, where, once the top-down observations are factored in, the most-likely numbers seem to be in the 1.9-2.6% range, with a few studies finding much higher leakage rates in some areas.
I did a quick Monte Carlo analysis to see what effect assuming a range of values would have on the overall in-BC emissions from one 18 Mt/year LNG project.
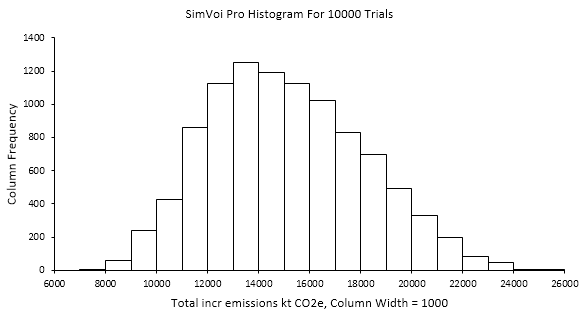
The results produce a median value of 15.1 Mt CO2e and a P5-P95 range of 10.5 to 20.5 Mt CO2e. My deterministic 14 Mt CO2e estimate is near the modal value of the probabilistic range. I made several assumptions about the distribution of the various uncertain input parameters and I can detail these in another post if there is interest from readers. The input factor that produces most of the variance is the methane leakage, for which I assumed a triangular distribution of zero to 2.7%, with a most likely value at 0.8%.
There are some twenty LNG projects that have been proposed for BC. If more than one of these is developed, the BC government is going to have to break or, more likely, remake its own Greenhouse Gas Reduction Targets Act. An LNG industry of the size that the government envisages (five plants) would likely result in eventual GHG emissions from the natural gas sector alone that would probably be bigger than the total emissions of the province in 2007.
The government in Victoria needs to face the fact that the big LNG industry that it has staked its electoral mandate on cannot be achieved without completely sacrificing its emissions targets. A smaller-scale LNG development that truly would be the cleanest in the world is technically feasible and possibly compatible with the province’s Climate Action Plan, but it would have to wait for much better market conditions for it to be economically viable.
[Not examined in either the Corporate Knights piece nor in this supplemental discussion are additional problems resulting from LNG and the consequent increased unconventional natural gas production such as earthquakes, water use and the agreement of First Nations. See also this recent story about the Fort Nelson First Nation’s fight against the BC Government and the unconventional natural gas industry. Nor have I considered the end-use emissions, which may or may not displace higher emissions from coal-fired electricity generation.]
References
Brandt, A. R., Heath, G. A., Kort, E. A., O’Sullivan, F., Pétron, G., Jordaan, S. M., … & Harriss, R. (2014). Methane leaks from North American natural gas systems. Science, 343(6172), 733-735.
Harriss, R., Alvarez, R. A., Lyon, D., Zavala-Araiza, D., Nelson, D., & Hamburg, S. P. (2015). Using Multi-Scale Measurements to Improve Methane Emission Estimates from Oil and Gas Operations in the Barnett Shale Region, Texas. Environmental science & technology, 49(13), 7524-7526.
Hausfather, Z. (2015). Bounding the climate viability of natural gas as a bridge fuel to displace coal. Energy Policy, 86, 286-294.
Myhre, G., D. Shindell, F.-M. Bréon, W. Collins, J. Fuglestvedt, J. Huang, D. Koch, J.-F. Lamarque, D. Lee, B. Mendoza, T. Nakajima, A. Robock, G. Stephens, T. Takemura and H. Zhang, (2013): Anthropogenic and Natural Radiative Forcing. In: Climate Change 2013: The Physical Science Basis. Contribution of Working Group I to the Fifth Assessment Report of the Intergovernmental Panel on Climate Change [Stocker, T.F., D. Qin, G.-K. Plattner, M. Tignor, S.K. Allen, J. Boschung, A. Nauels, Y. Xia, V. Bex and P.M. Midgley (eds.)]. Cambridge University Press, Cambridge, United Kingdom and New York, NY, USA

Pingback: B.C. lowballing fugitive methane emissions from natural gas industry | Enjeux énergies et environnement
Pingback: B.C. lowballing fugitive methane emissions from natural gas industry
Pingback: Volkswagen Got Caught Cheating Emissions Reporting. Will B.C.? | Critical Angle
nice
thanks!